Help
HuCoVaria Homepage
The 'Home' page provides information about the databse and helps the user navigate to other pages of tha database.

- Enter your human proteins. These values must be comma separated. Gene symbols are supported only. Type directly into the box or upload a file with your comma-separated proteins.

- Select which strains of SARS-CoV-2 to be included in your query. More information on strains can be found at: Pango Lineages.

- Select which SARS-CoV-2 proteins to be included in your predicted interactions.

- Select which annotation type to be included. More information on each annotation type can be found here:

- Select which interaction type:
Interolog interactions are based off the interolog approach, involving NCBI's BLAST, to predicting Host-Pathogen Interactions (HPIs). The interolog databases used can be found at the 'Datasets' tab.
Domain interactions involve predicting HPIs via the interactions between specific domains, or subunits of proteins. This approach utilizes HMMER, and several domain-domain interaction databases, also found under the 'Datasets' tab.
Combined interactions include both interolog and domain interactions.
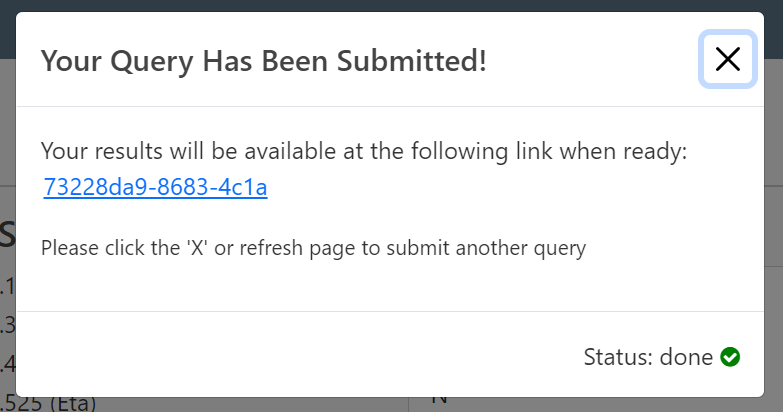
- Click the 'Submit Query' to send in your query. A pop-up window will be displayed and have a link to the table view of your results and an indicator representing the progress of your query.

Interactome Search
The interactome search allows the users to obtain interactions for the available COVID strains. The users can select various human and/or COVID proteins to obtain the interactions, along with different annotations and interaction type as shown below.

Table View
The table view displays all of the interaction information in a paginated-table format. Viral gene, host gene, strain, interaction type and annotation information are all displayed in the table. There are two buttons to download the table: one in an excel format and the other in a csv format. There is also a search bar to narrow down entries. Here is a typical table view:

Click the 'To Network View' to display the original interaction information in a network view.
Network View
The network view displays the interaction information as a network utilizing Cytoscape.js to create the network. Only the viral and host proteins and SARS-CoV-2 strains are displayed. The proteins are displayed as nodes whereas the strains are displayed as edges. A legend is provided and edges and nodes can be removed as well. Right clicking and holding on a node gives options to access more information about that protein. Here is a typical network view:

Here is a snapshot of the menu provided when right-clicking and holding on a node:
