Input data and parameters
QualiMap command line
| qualimap bamqc -bam ../hcapsulatum/2-alignment/pathogen/bam/genome/SRR950198_hisat2.bam -nw 400 -hm 3 |
Alignment
| Command line: | "/home/dguevara/pipeline/src/../tools/hisat2-2.1.0/hisat2-align-s --wrapper basic-0 -x ../hcapsulatum/2-alignment/pathogen/indices/hisat2/genome -S ../hcapsulatum/2-alignment/pathogen/sam/genome/SRR950198_hisat2.sam -p 16 -1 ../hcapsulatum/2-alignment/host/fastq/SRR950198_1.fastq -2 ../hcapsulatum/2-alignment/host/fastq/SRR950198_2.fastq" |
| Draw chromosome limits: | no |
| Analyze overlapping paired-end reads: | no |
| Program: | hisat2 (2.1.0) |
| Analysis date: | Thu Jan 25 04:55:09 CST 2024 |
| Size of a homopolymer: | 3 |
| Skip duplicate alignments: | no |
| Number of windows: | 400 |
| BAM file: | ../hcapsulatum/2-alignment/pathogen/bam/genome/SRR950198_hisat2.bam |
Summary
Globals
| Reference size | 30,483,324 |
| Number of reads | 16,007,597 |
| Mapped reads | 11,080,836 / 69.22% |
| Unmapped reads | 4,926,761 / 30.78% |
| Mapped paired reads | 11,080,836 / 69.22% |
| Mapped reads, first in pair | 5,535,558 / 34.58% |
| Mapped reads, second in pair | 5,545,278 / 34.64% |
| Mapped reads, both in pair | 8,714,371 / 54.44% |
| Mapped reads, singletons | 2,366,465 / 14.78% |
| Read min/max/mean length | 80 / 80 / 80 |
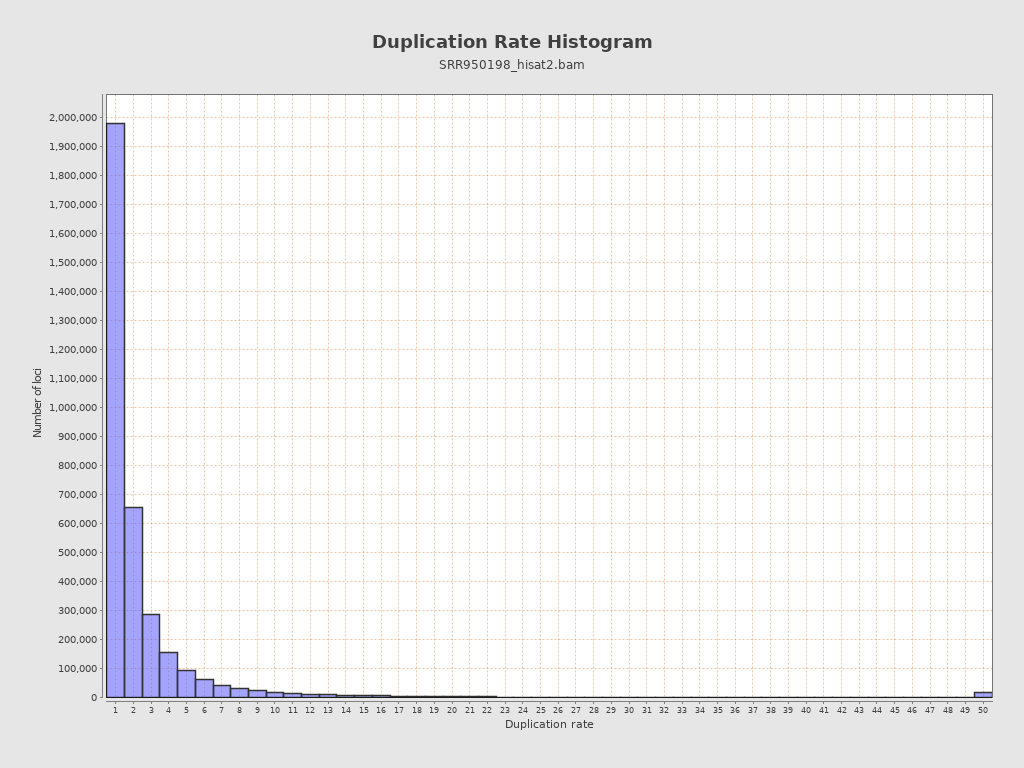
| Duplicated reads (estimated) | 7,586,306 / 47.39% |
| Duplication rate | 43.36% |
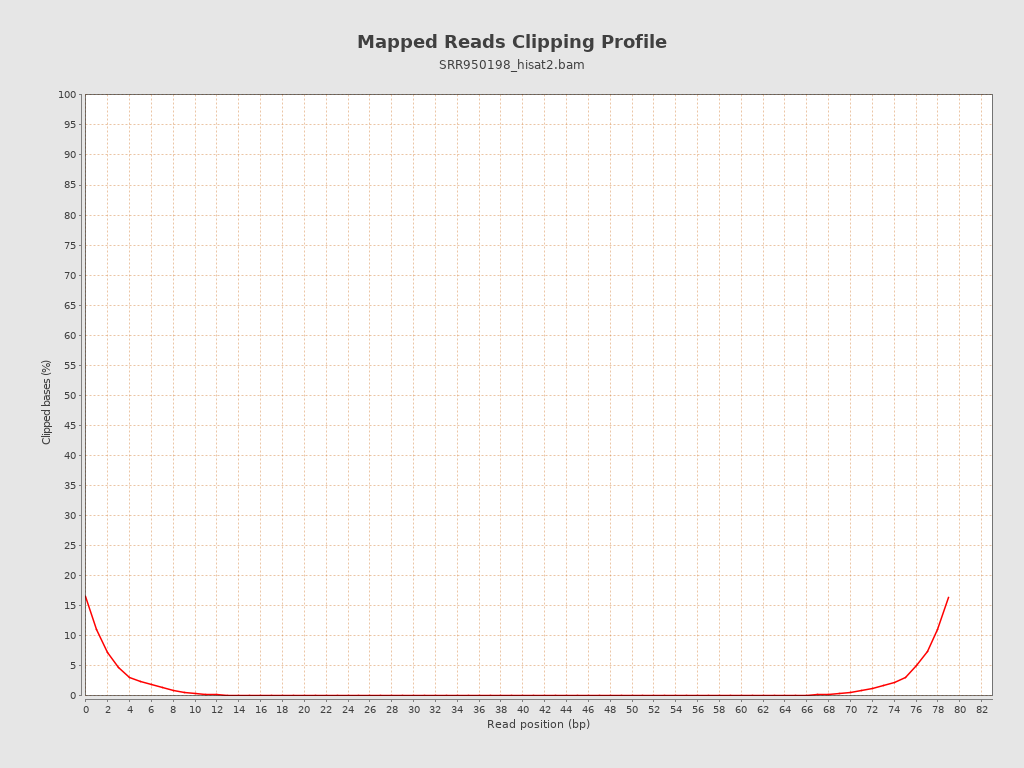
| Clipped reads | 1,642,331 / 10.26% |
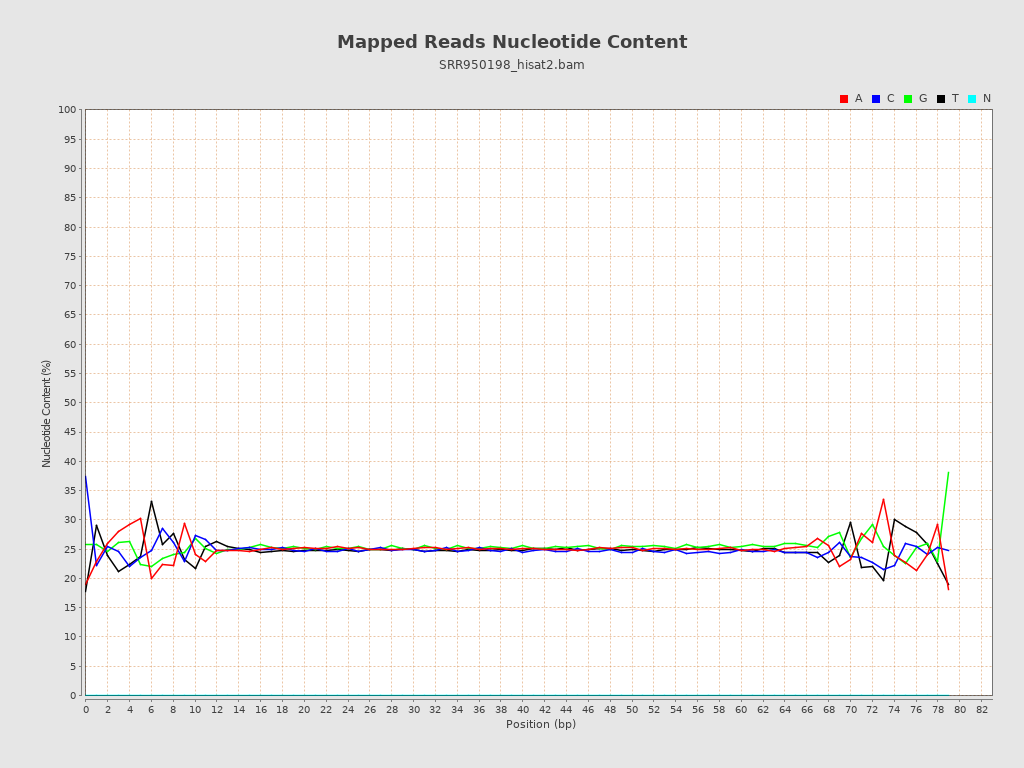
ACGT Content
| Number/percentage of A's | 220,085,608 / 24.98% |
| Number/percentage of C's | 218,681,914 / 24.82% |
| Number/percentage of T's | 218,383,639 / 24.79% |
| Number/percentage of G's | 223,857,167 / 25.41% |
| Number/percentage of N's | 649,391,401 / 73.71% |
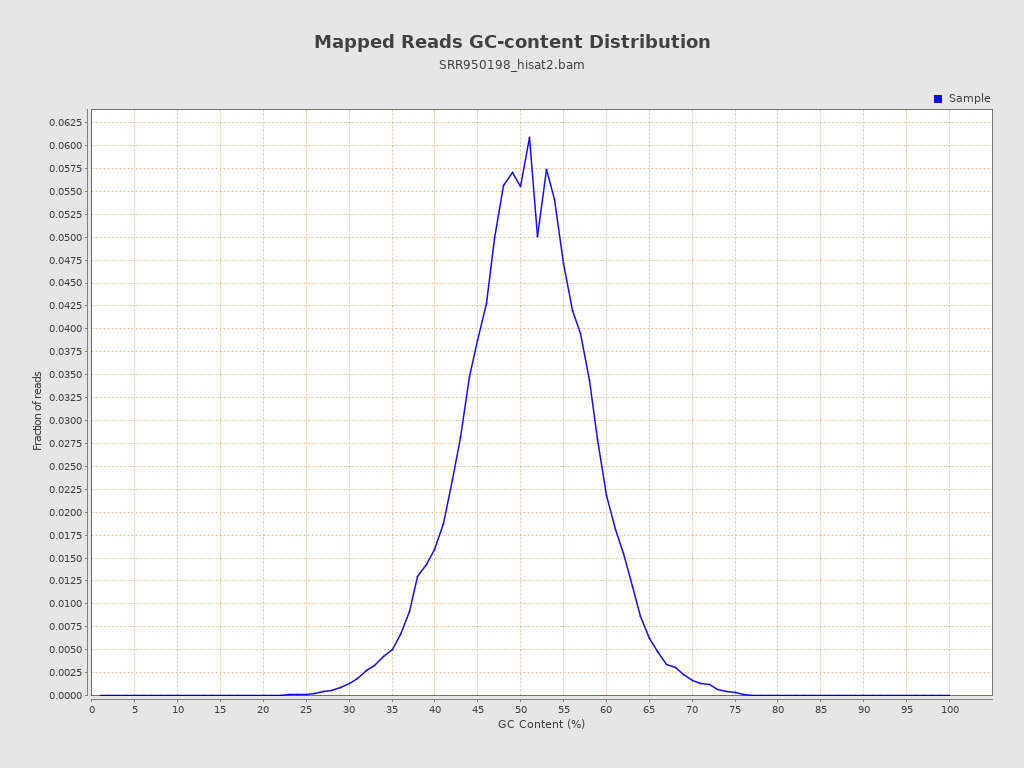
| GC Percentage | 50.23% |
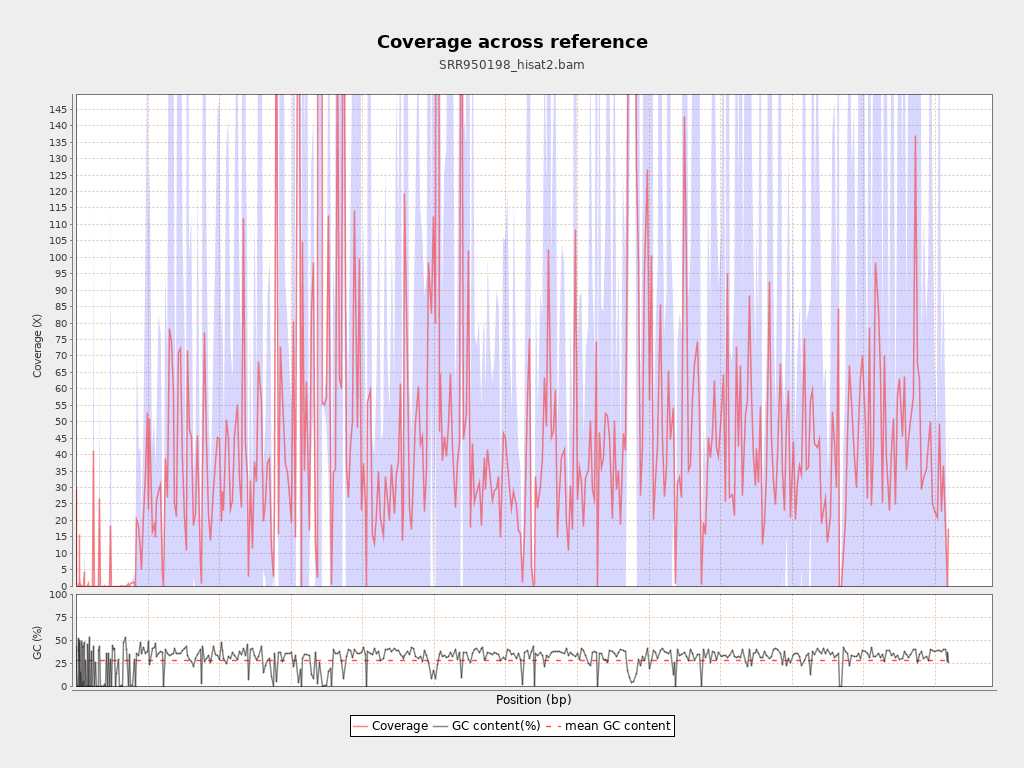
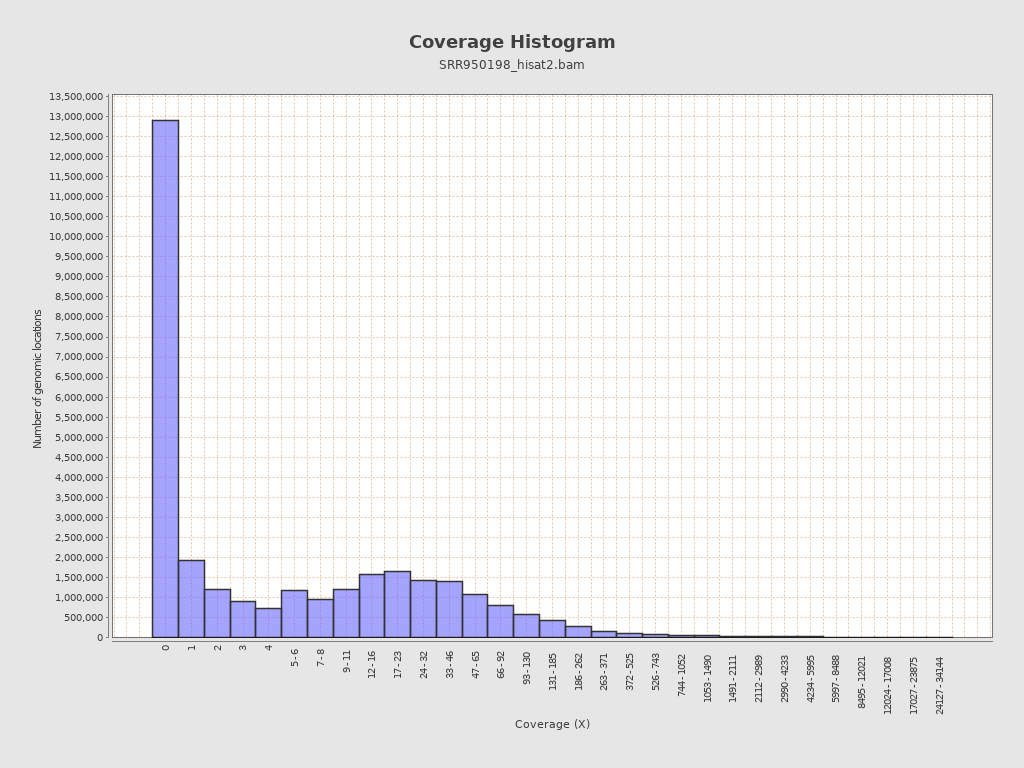
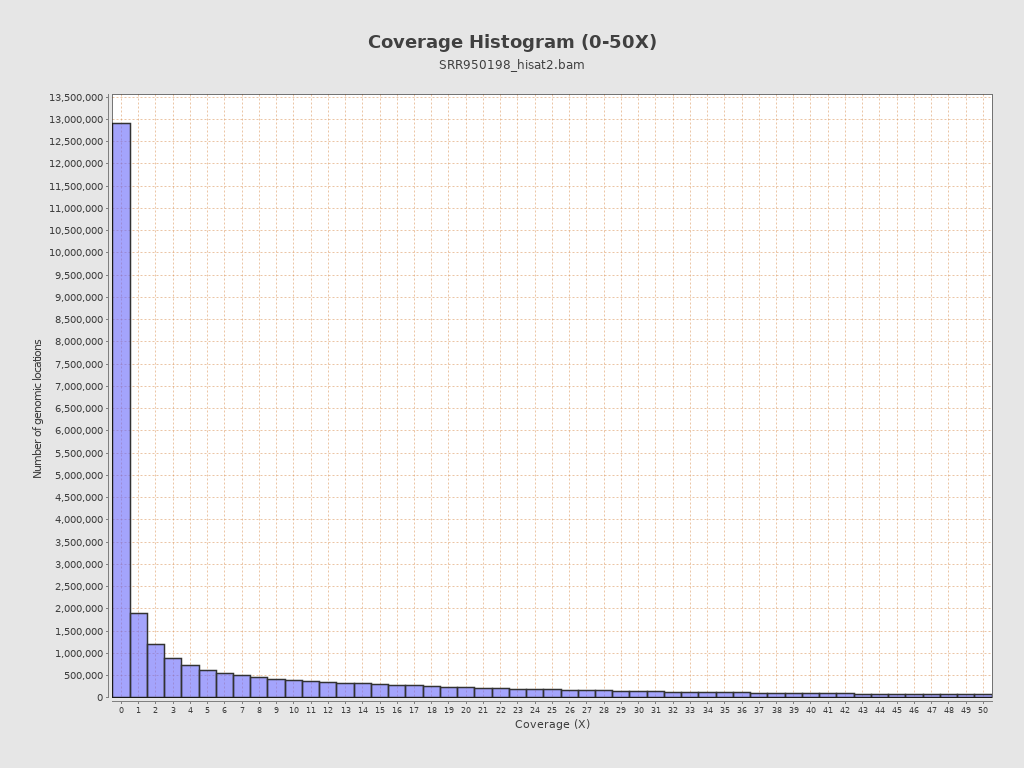
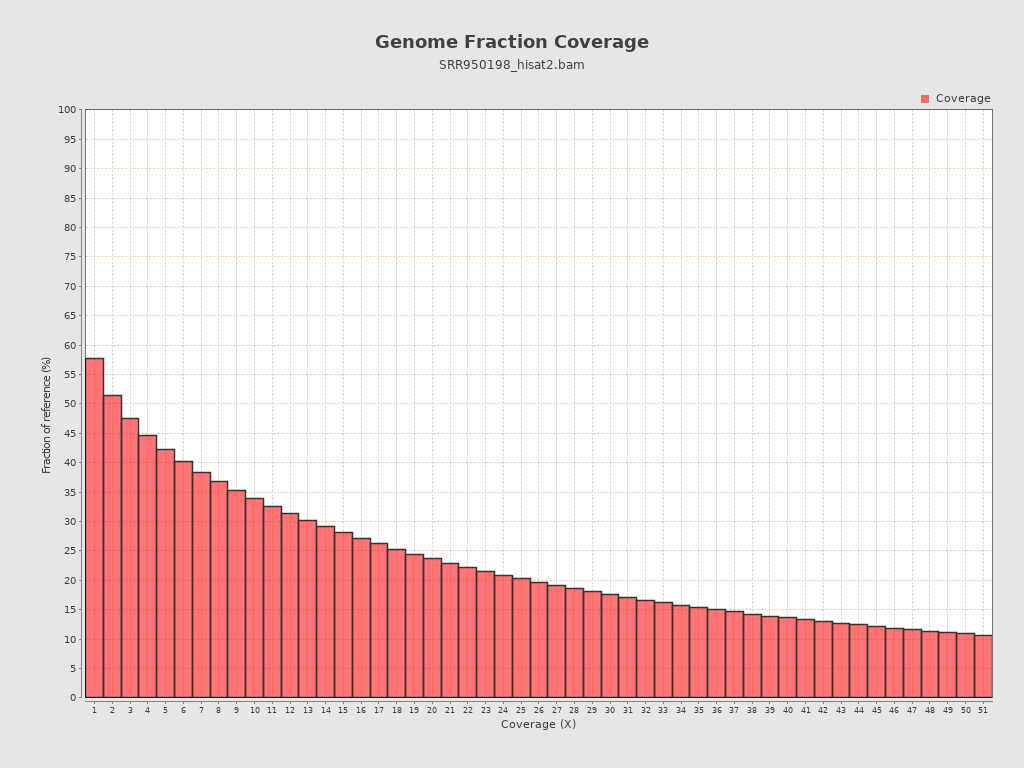
Coverage
| Mean | 50.2094 |
| Standard Deviation | 206.1942 |
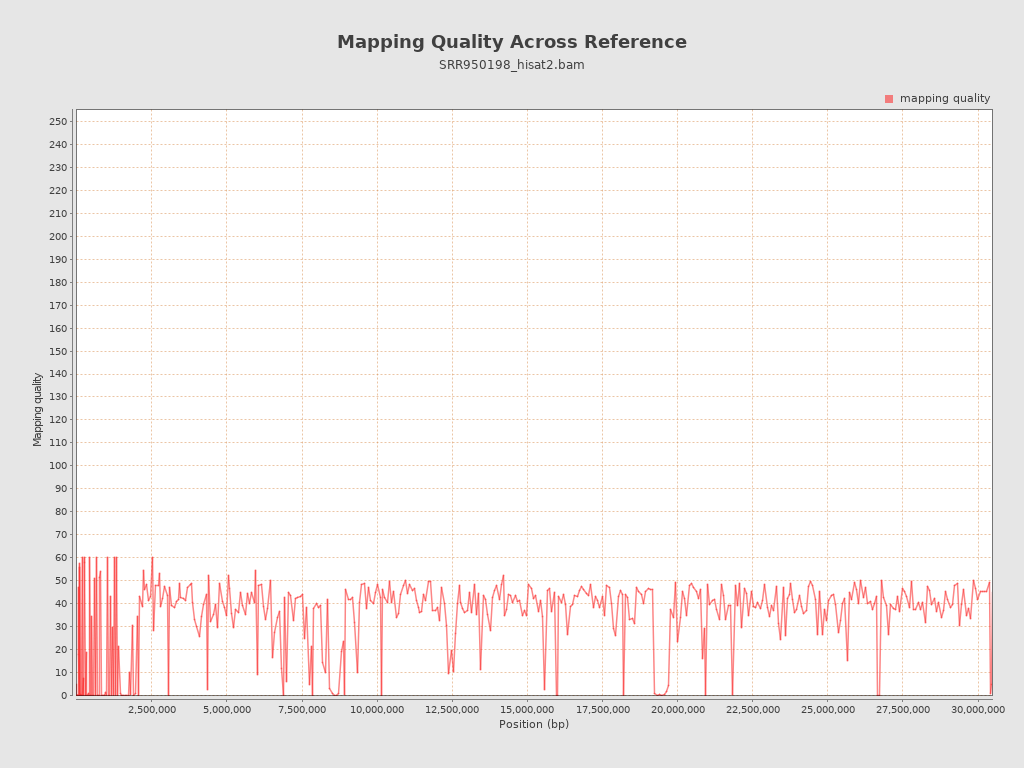
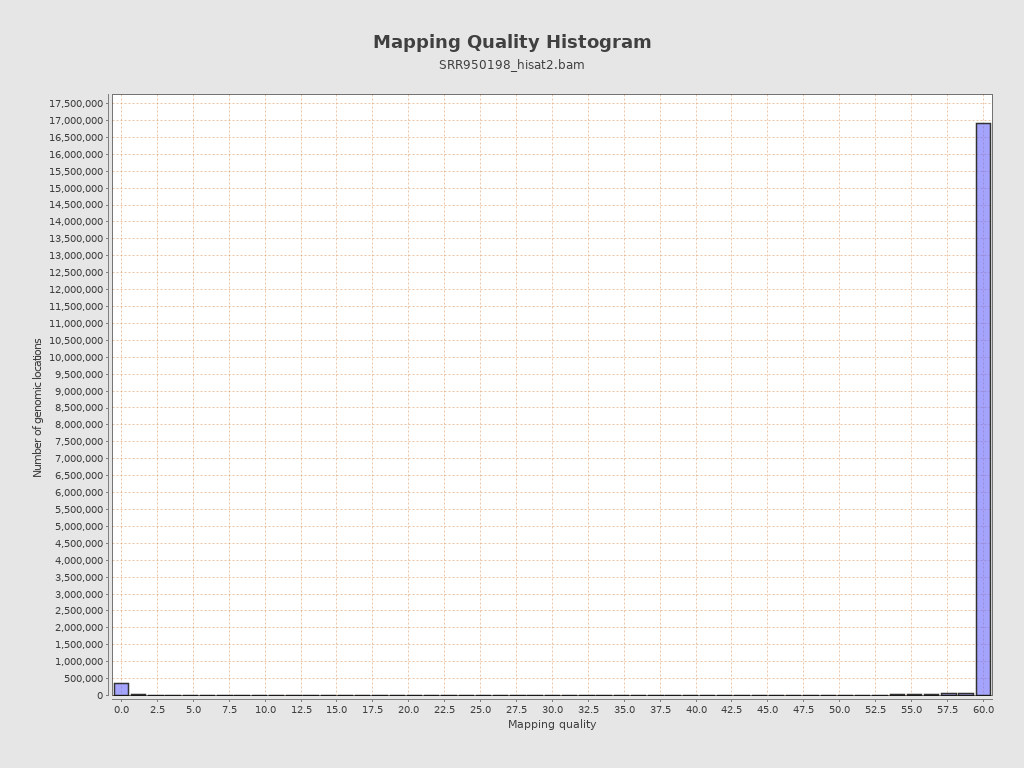
Mapping Quality
| Mean Mapping Quality | 32.37 |
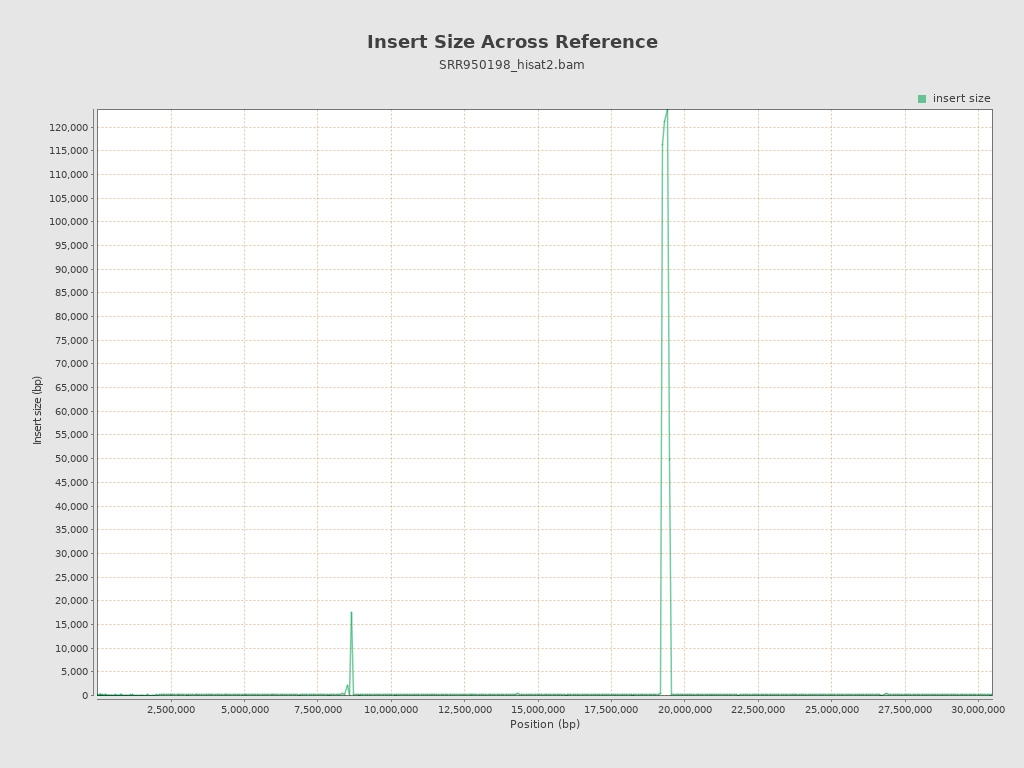
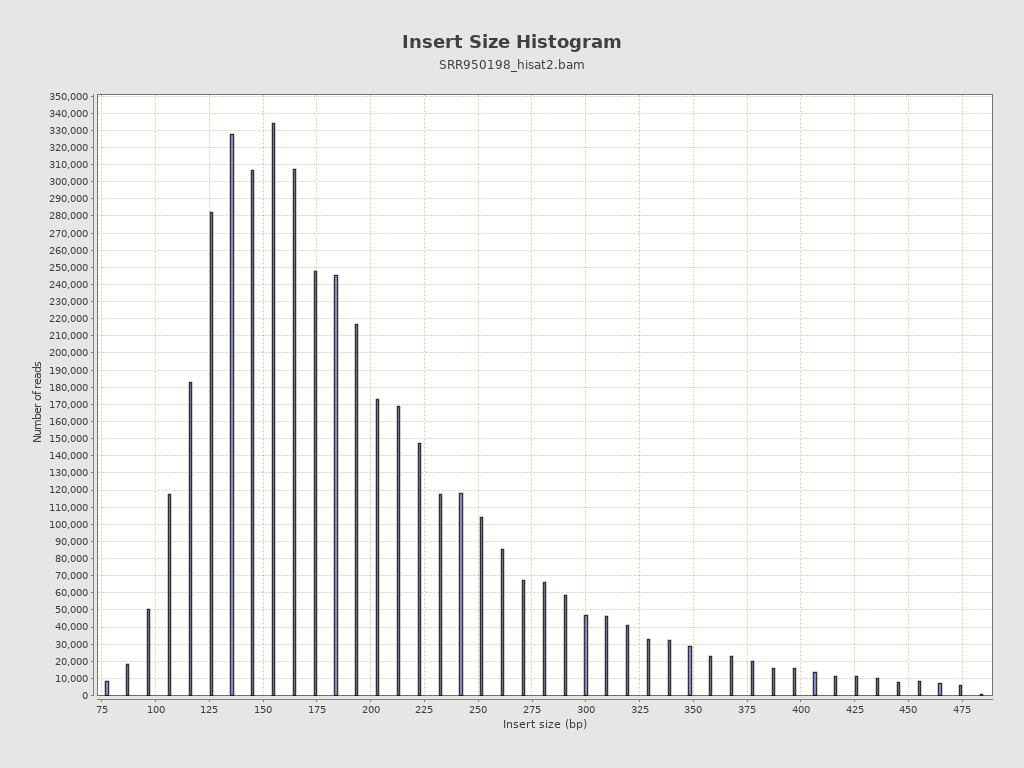
Insert size
| Mean | 2,384.04 |
| Standard Deviation | 26,113.87 |
| P25/Median/P75 | 148 / 183 / 242 |
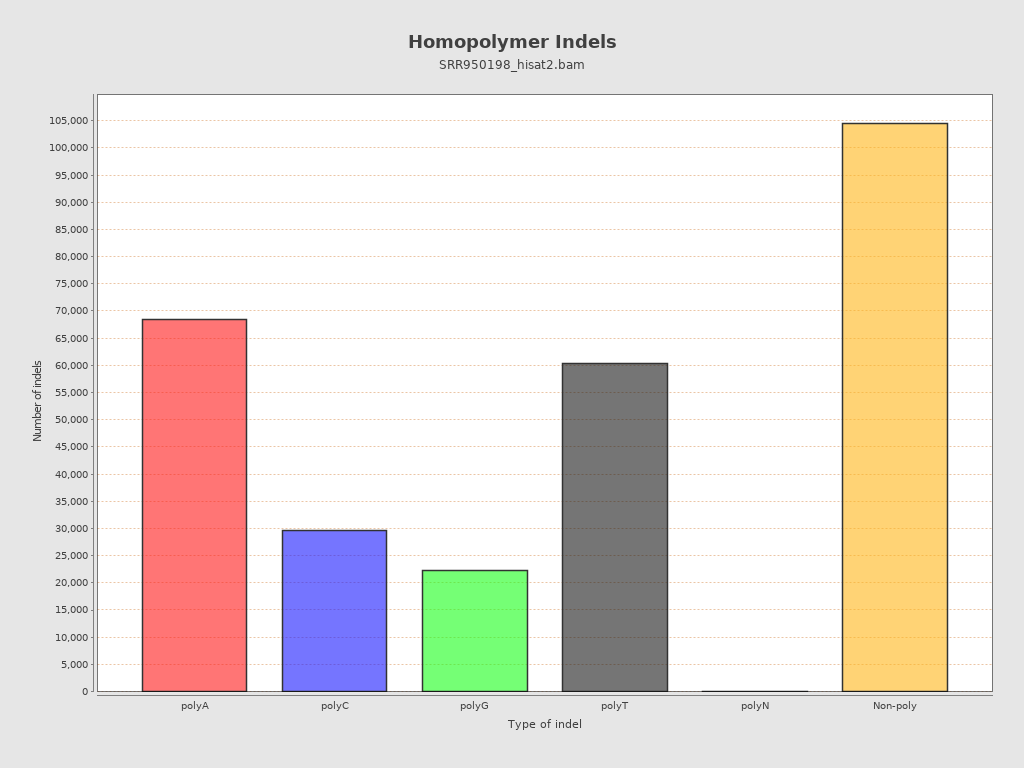
Mismatches and indels
| General error rate | 0.8% |
| Mismatches | 12,008,175 |
| Insertions | 160,395 |
| Mapped reads with at least one insertion | 1.44% |
| Deletions | 124,823 |
| Mapped reads with at least one deletion | 1.12% |
| Homopolymer indels | 63.36% |
Chromosome stats
| Name | Length | Mapped bases | Mean coverage | Standard deviation |
| GG663448.1 | 2407 | 70775 | 29.4038 | 40.5912 |
| GG663447.1 | 5093 | 1059 | 0.2079 | 0.4605 |
| GG663446.1 | 5267 | 0 | 0 | 0 |
| GG663445.1 | 5726 | 0 | 0 | 0 |
| GG663444.1 | 6104 | 0 | 0 | 0 |
| GG663443.1 | 6704 | 0 | 0 | 0 |
| GG663442.1 | 7013 | 0 | 0 | 0 |
| GG663441.1 | 7428 | 0 | 0 | 0 |
| GG663440.1 | 7433 | 0 | 0 | 0 |
| GG663439.1 | 7612 | 0 | 0 | 0 |
| GG663438.1 | 9352 | 395 | 0.0422 | 0.2737 |
| GG663437.1 | 9532 | 3700 | 0.3882 | 2.0373 |
| GG663436.1 | 9723 | 154175 | 15.8567 | 18.2968 |
| GG663435.1 | 10315 | 0 | 0 | 0 |
| GG663434.1 | 11106 | 31129 | 2.8029 | 6.9688 |
| GG663433.1 | 11483 | 0 | 0 | 0 |
| GG663432.1 | 11832 | 0 | 0 | 0 |
| GG663431.1 | 11849 | 917 | 0.0774 | 0.2969 |
| GG663430.1 | 11959 | 0 | 0 | 0 |
| GG663429.1 | 12280 | 0 | 0 | 0 |
| GG663428.1 | 12330 | 1039 | 0.0843 | 0.3807 |
| GG663427.1 | 12422 | 65 | 0.0052 | 0.0721 |
| GG663426.1 | 14805 | 0 | 0 | 0 |
| GG663425.1 | 15274 | 1296 | 0.0849 | 0.1252 |
| GG663424.1 | 15855 | 0 | 0 | 0 |
| GG663423.1 | 16334 | 239 | 0.0146 | 0.1201 |
| GG663422.1 | 16757 | 77460 | 4.6225 | 10.8371 |
| GG663421.1 | 17071 | 0 | 0 | 0 |
| GG663420.1 | 17227 | 0 | 0 | 0 |
| GG663419.1 | 17524 | 248 | 0.0142 | 0.1207 |
| GG663418.1 | 17580 | 0 | 0 | 0 |
| GG663417.1 | 18806 | 0 | 0 | 0 |
| GG663416.1 | 20314 | 240 | 0.0118 | 0.1281 |
| GG663415.1 | 20172 | 18466 | 0.9154 | 0.9136 |
| GG663414.1 | 21124 | 0 | 0 | 0 |
| GG663413.1 | 21814 | 160 | 0.0073 | 0.1201 |
| GG663412.1 | 22664 | 0 | 0 | 0 |
| GG663411.1 | 23942 | 0 | 0 | 0 |
| GG663410.1 | 24438 | 927 | 0.0379 | 0.6354 |
| GG663409.1 | 30061 | 0 | 0 | 0 |
| GG663408.1 | 29608 | 0 | 0 | 0 |
| GG663407.1 | 31202 | 1288574 | 41.2978 | 76.9721 |
| GG663406.1 | 31468 | 0 | 0 | 0 |
| GG663405.1 | 33416 | 389 | 0.0116 | 0.1632 |
| GG663404.1 | 33436 | 0 | 0 | 0 |
| GG663403.1 | 34148 | 0 | 0 | 0 |
| GG663402.1 | 35232 | 35085 | 0.9958 | 2.1029 |
| GG663401.1 | 36230 | 965720 | 26.6553 | 36.6236 |
| GG663400.1 | 40055 | 0 | 0 | 0 |
| GG663399.1 | 47125 | 0 | 0 | 0 |
| GG663398.1 | 49169 | 0 | 0 | 0 |
| GG663397.1 | 50304 | 9625 | 0.1913 | 0.2265 |
| GG663396.1 | 51171 | 67 | 0.0013 | 0.0362 |
| GG663395.1 | 53466 | 0 | 0 | 0 |
| GG663394.1 | 53864 | 335 | 0.0062 | 0.0666 |
| GG663393.1 | 55852 | 1026474 | 18.3785 | 103.4098 |
| GG663392.1 | 60589 | 156 | 0.0026 | 0.066 |
| GG663391.1 | 76172 | 158 | 0.0021 | 0.0455 |
| GG663390.1 | 87620 | 214 | 0.0024 | 0.0295 |
| GG663389.1 | 88906 | 80 | 0.0009 | 0.03 |
| GG663388.1 | 95026 | 23164 | 0.2438 | 0.2462 |
| GG663387.1 | 113334 | 2492 | 0.022 | 0.3719 |
| GG663386.1 | 144210 | 54088 | 0.3751 | 0.3991 |
| GG663385.1 | 156336 | 156730 | 1.0025 | 2.1033 |
| GG663384.1 | 204511 | 3249209 | 15.8877 | 35.9863 |
| GG663383.1 | 258077 | 7514139 | 29.1159 | 72.8159 |
| GG663382.1 | 261570 | 7227581 | 27.6315 | 53.623 |
| GG663381.1 | 280411 | 6386095 | 22.7741 | 39.9752 |
| GG663380.1 | 351122 | 18843875 | 53.6676 | 152.9449 |
| GG663379.1 | 441739 | 18308788 | 41.4471 | 115.8331 |
| GG663378.1 | 530530 | 18154035 | 34.2187 | 97.8665 |
| GG663377.1 | 695743 | 26572912 | 38.1936 | 88.0417 |
| GG663376.1 | 920403 | 39197586 | 42.5874 | 126.5094 |
| GG663375.1 | 915096 | 28502269 | 31.1468 | 87.1342 |
| GG663374.1 | 967551 | 69041384 | 71.3568 | 131.4483 |
| GG663373.1 | 1058542 | 200423523 | 189.3392 | 679.656 |
| GG663372.1 | 1221551 | 82238346 | 67.3229 | 218.797 |
| GG663371.1 | 1250234 | 39006681 | 31.1995 | 87.2589 |
| GG663370.1 | 1327755 | 114947019 | 86.5725 | 517.4924 |
| GG663369.1 | 1498222 | 76568443 | 51.1062 | 136.3279 |
| GG663368.1 | 1769553 | 51608073 | 29.1645 | 67.4808 |
| GG663367.1 | 2225114 | 88642327 | 39.8372 | 120.7937 |
| GG663366.1 | 2702831 | 203145421 | 75.1602 | 186.5362 |
| GG663365.1 | 2818386 | 137235732 | 48.693 | 158.8153 |
| GG663364.1 | 2928037 | 116302049 | 39.7201 | 96.146 |
| GG663363.1 | 3777229 | 172801664 | 45.7483 | 127.9201 |
| GG663450.1 | 4245 | 6344 | 1.4945 | 5.2419 |
| GG663449.1 | 40201 | 698876 | 17.3845 | 42.2876 |