Input data and parameters
QualiMap command line
| qualimap bamqc -bam ../hcapsulatum/2-alignment/pathogen/bam/genome/SRR950197_hisat2.bam -nw 400 -hm 3 |
Alignment
| Command line: | "/home/dguevara/pipeline/src/../tools/hisat2-2.1.0/hisat2-align-s --wrapper basic-0 -x ../hcapsulatum/2-alignment/pathogen/indices/hisat2/genome -S ../hcapsulatum/2-alignment/pathogen/sam/genome/SRR950197_hisat2.sam -p 16 -1 ../hcapsulatum/2-alignment/host/fastq/SRR950197_1.fastq -2 ../hcapsulatum/2-alignment/host/fastq/SRR950197_2.fastq" |
| Draw chromosome limits: | no |
| Analyze overlapping paired-end reads: | no |
| Program: | hisat2 (2.1.0) |
| Analysis date: | Thu Jan 25 04:55:12 CST 2024 |
| Size of a homopolymer: | 3 |
| Skip duplicate alignments: | no |
| Number of windows: | 400 |
| BAM file: | ../hcapsulatum/2-alignment/pathogen/bam/genome/SRR950197_hisat2.bam |
Summary
Globals
| Reference size | 30,483,324 |
| Number of reads | 16,826,439 |
| Mapped reads | 11,356,058 / 67.49% |
| Unmapped reads | 5,470,381 / 32.51% |
| Mapped paired reads | 11,356,058 / 67.49% |
| Mapped reads, first in pair | 5,664,424 / 33.66% |
| Mapped reads, second in pair | 5,691,634 / 33.83% |
| Mapped reads, both in pair | 8,801,364 / 52.31% |
| Mapped reads, singletons | 2,554,694 / 15.18% |
| Read min/max/mean length | 80 / 80 / 80 |
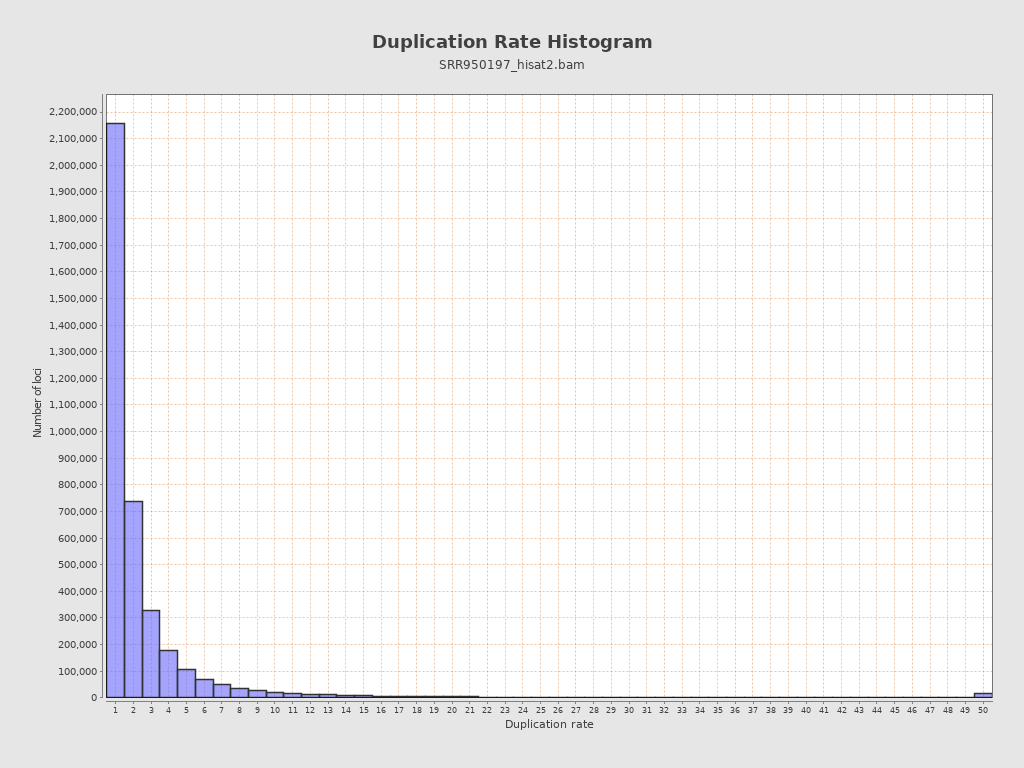
| Duplicated reads (estimated) | 7,501,783 / 44.58% |
| Duplication rate | 44.05% |
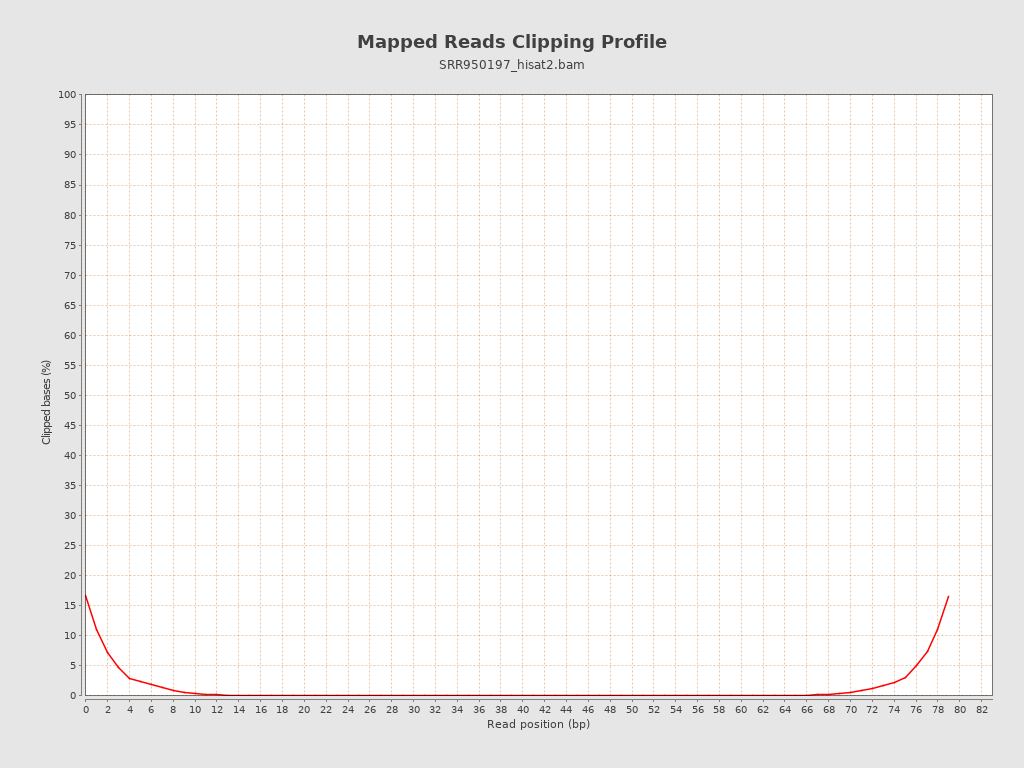
| Clipped reads | 1,752,407 / 10.41% |
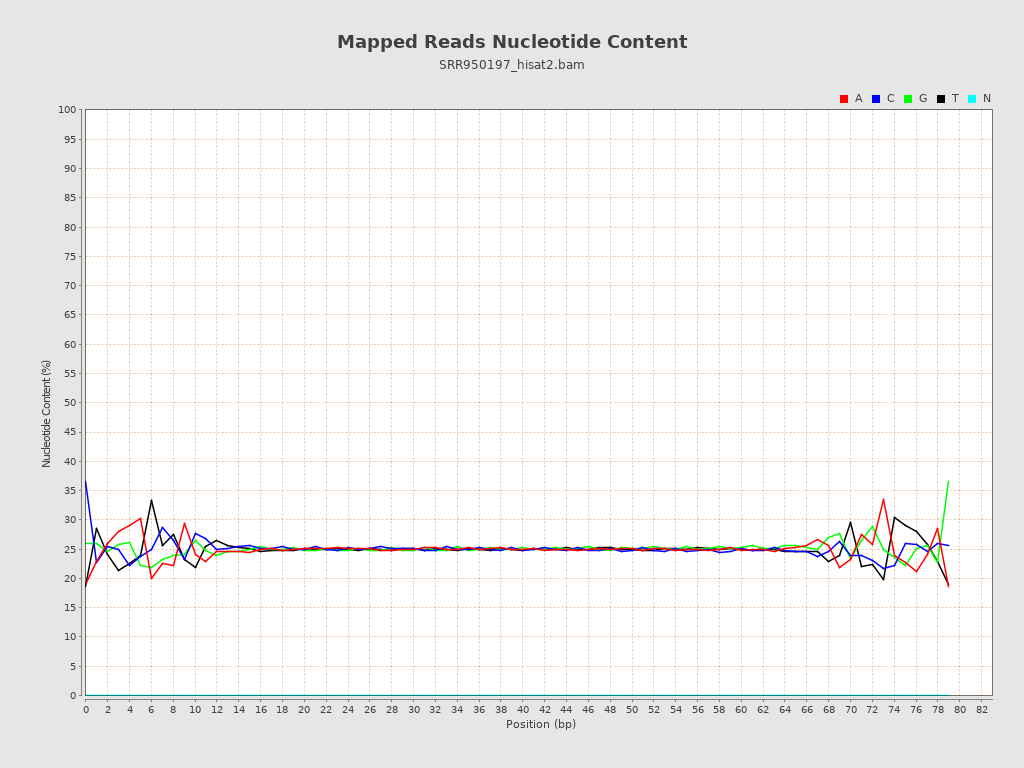
ACGT Content
| Number/percentage of A's | 224,957,114 / 24.92% |
| Number/percentage of C's | 226,158,511 / 25.05% |
| Number/percentage of T's | 224,650,394 / 24.89% |
| Number/percentage of G's | 226,948,003 / 25.14% |
| Number/percentage of N's | 620,956,672 / 68.79% |
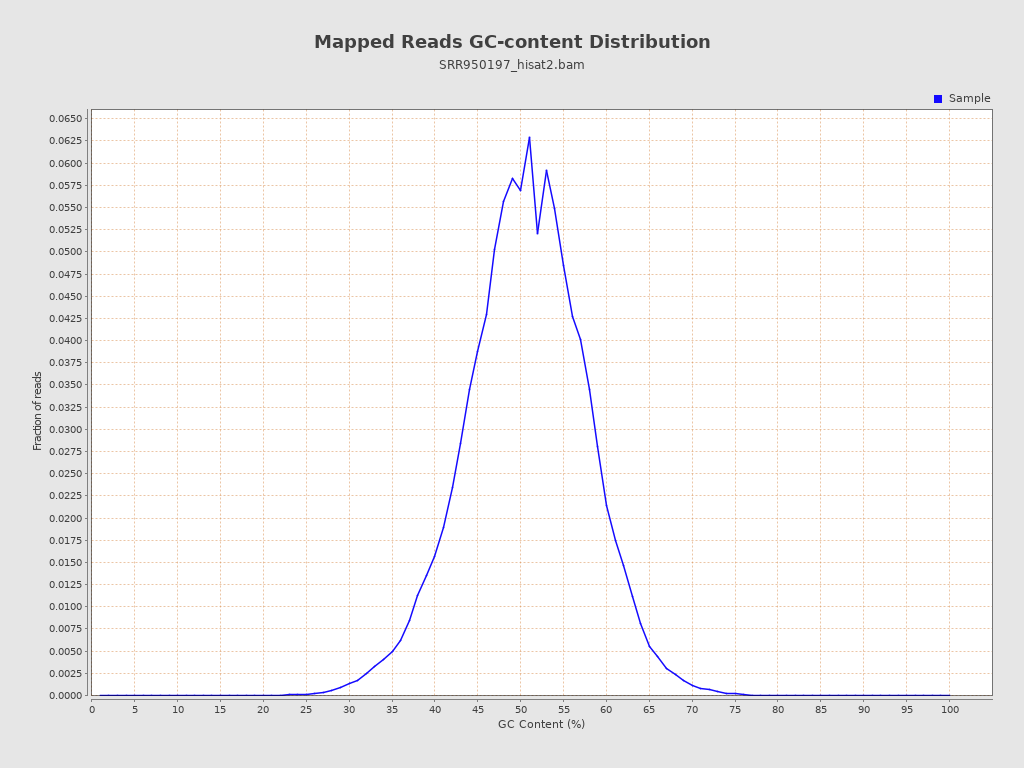
| GC Percentage | 50.19% |
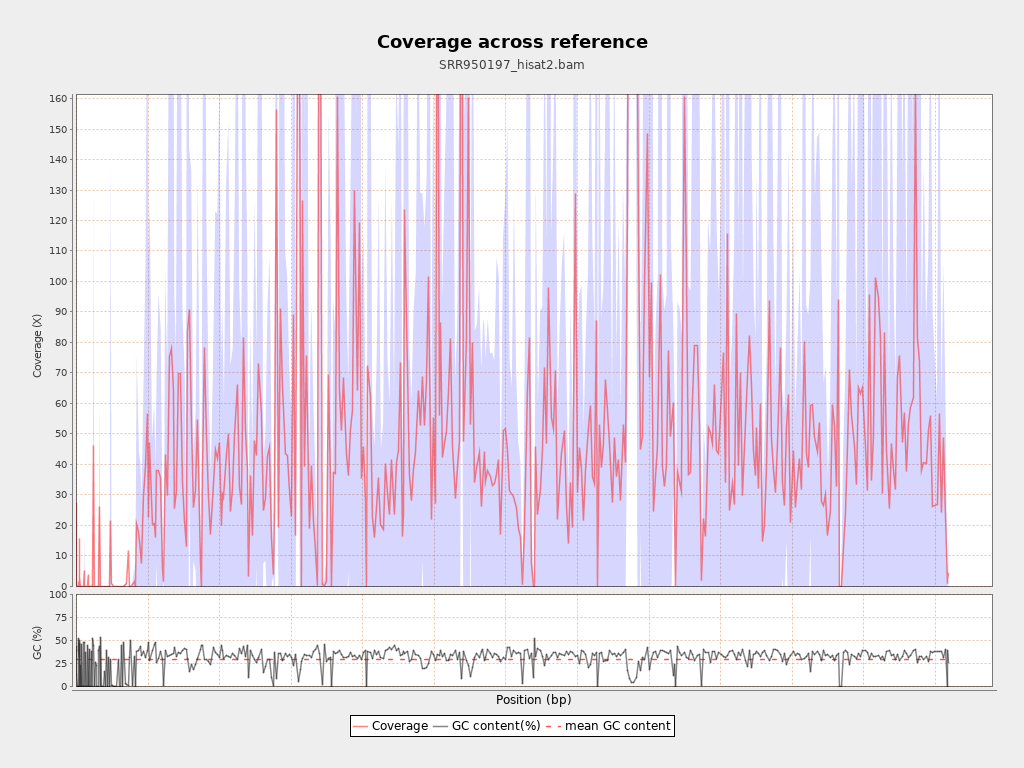
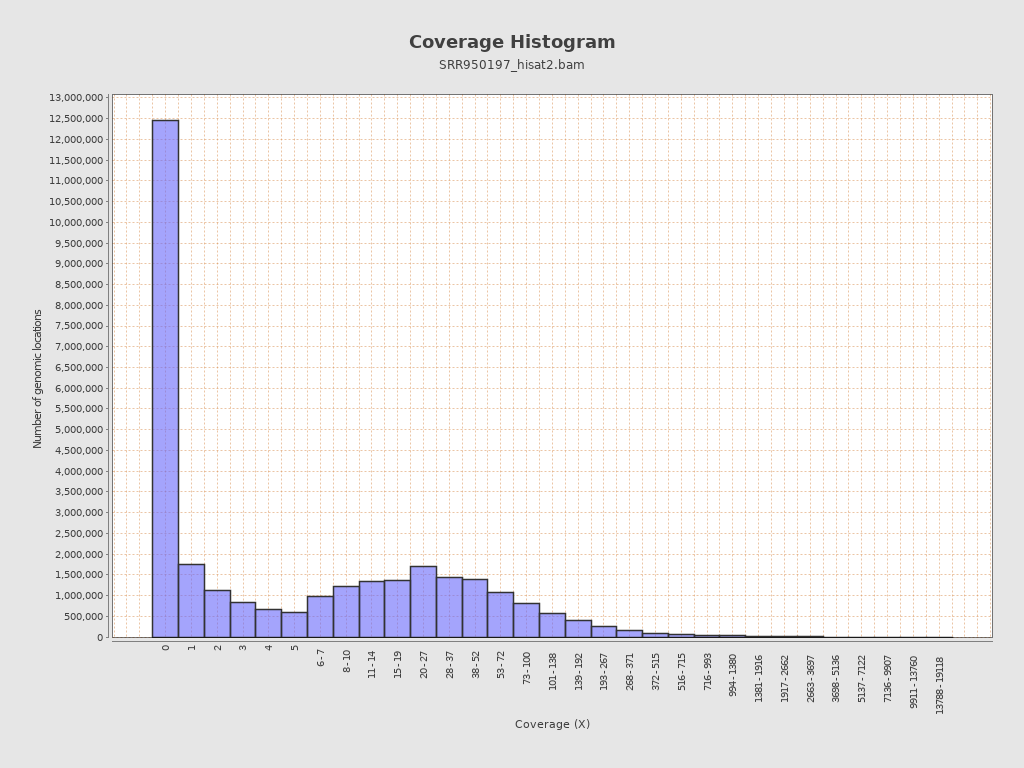
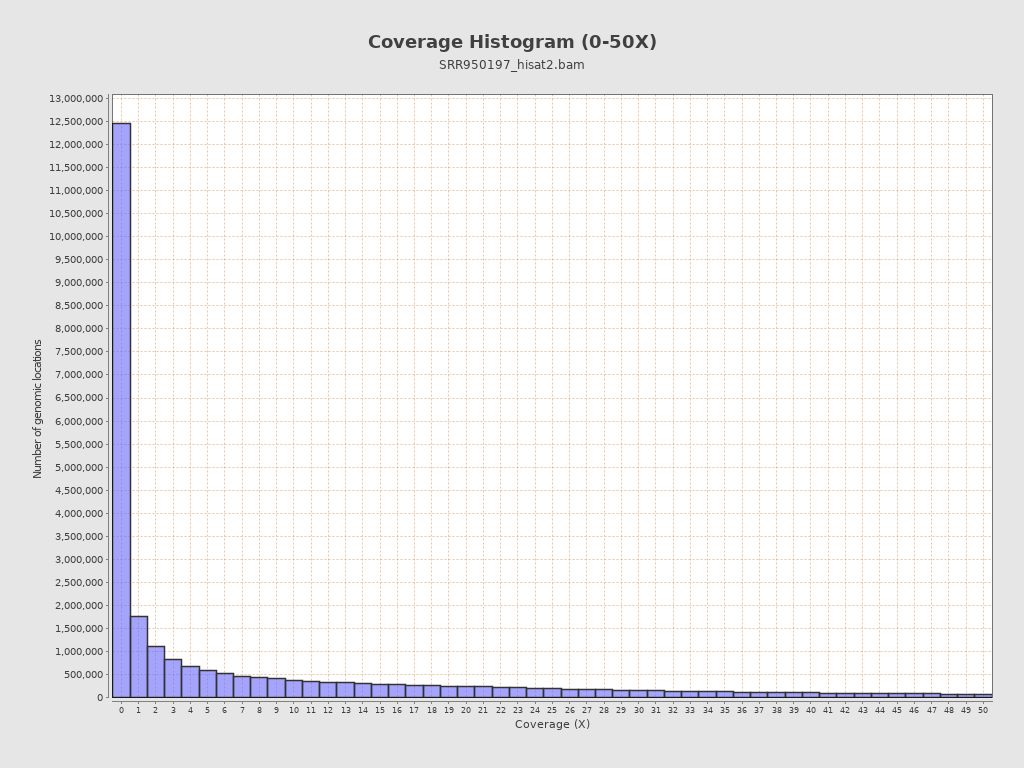
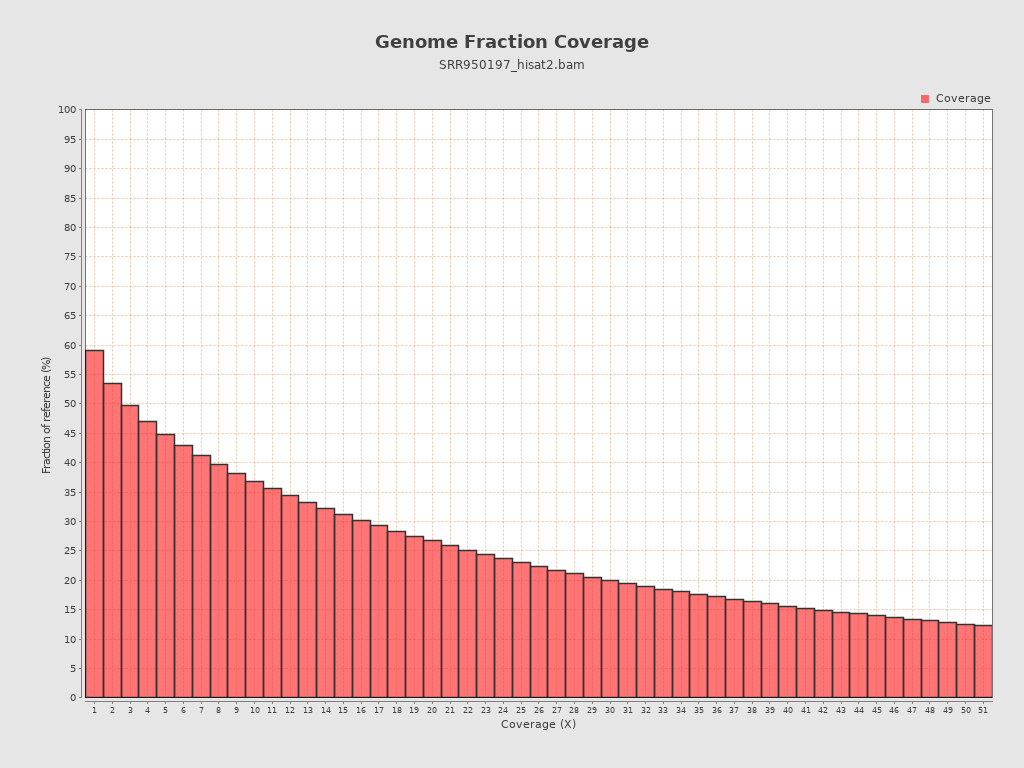
Coverage
| Mean | 49.9882 |
| Standard Deviation | 156.1658 |
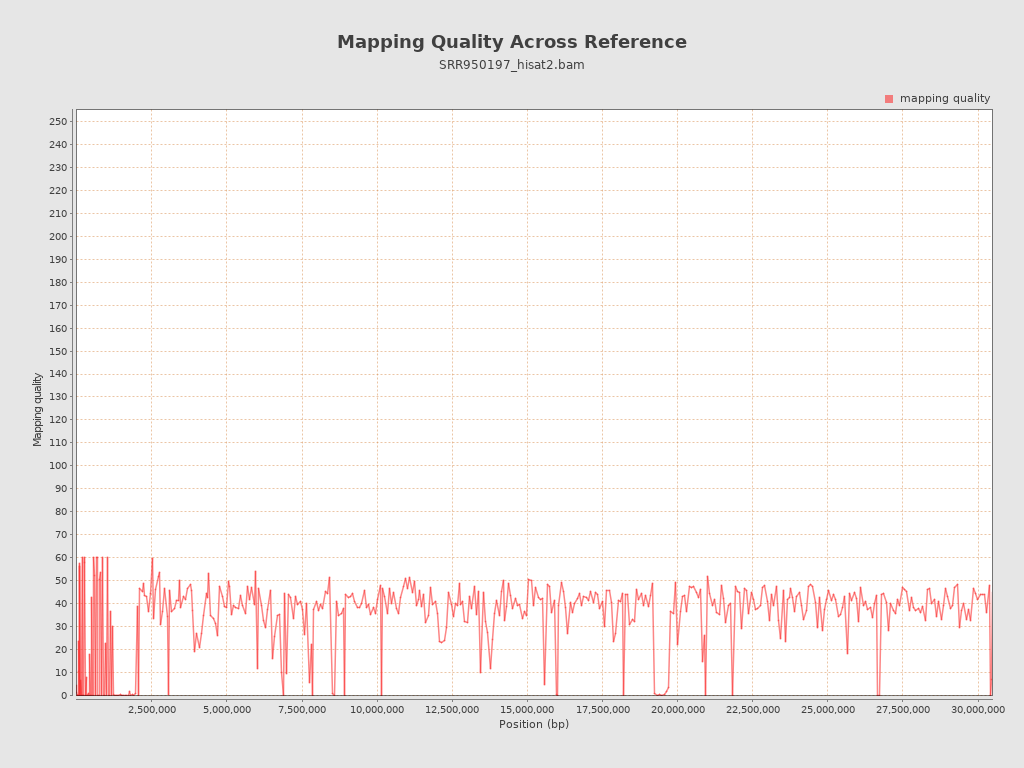
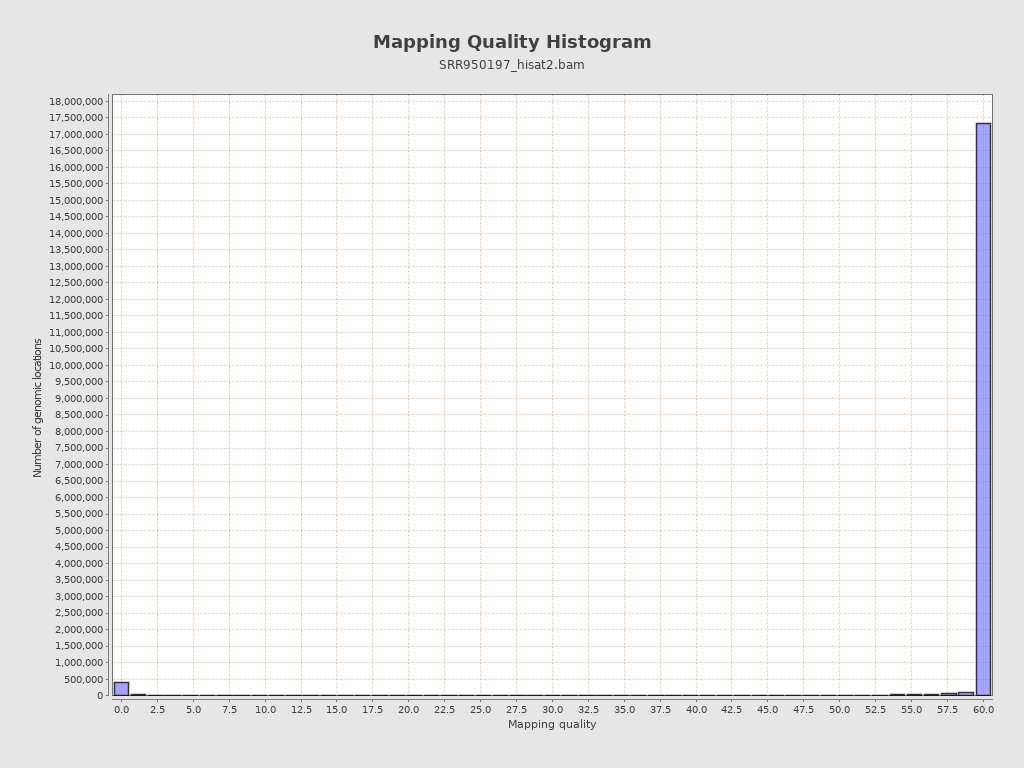
Mapping Quality
| Mean Mapping Quality | 32.34 |
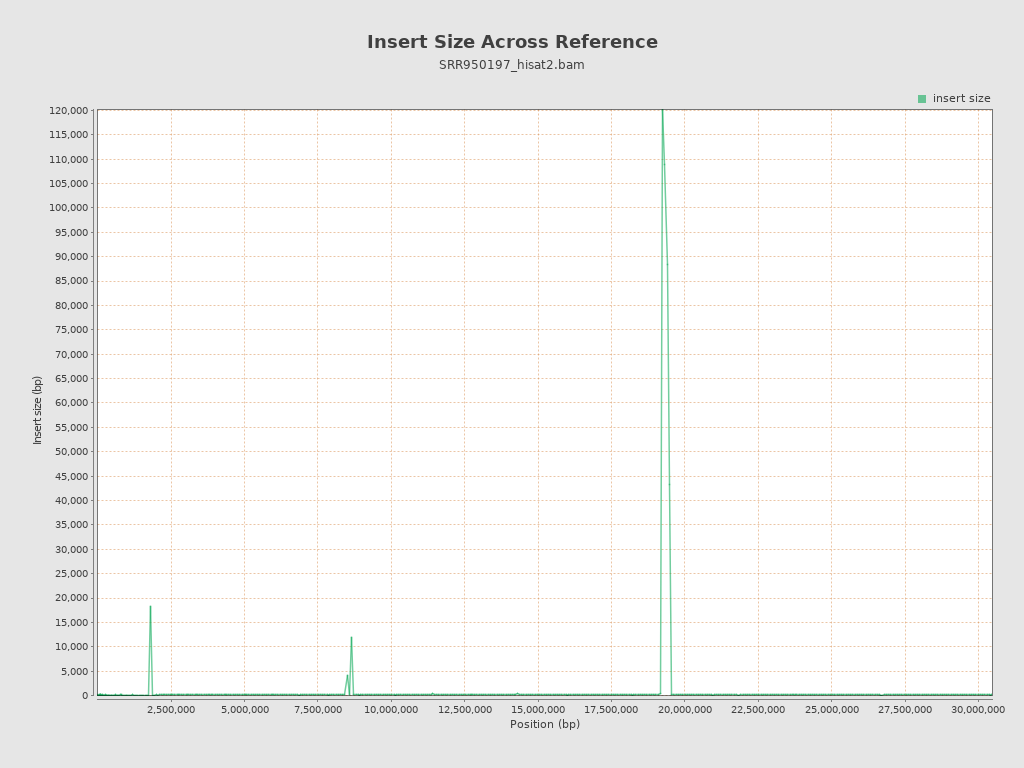
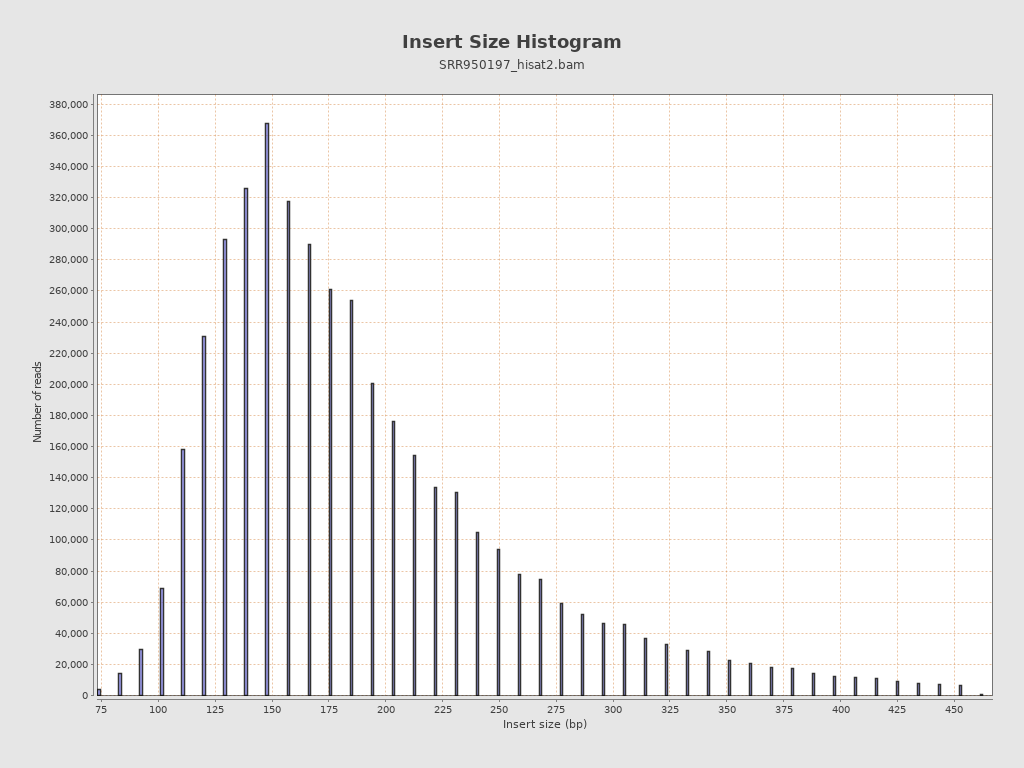
Insert size
| Mean | 2,239.05 |
| Standard Deviation | 25,325.1 |
| P25/Median/P75 | 147 / 179 / 231 |
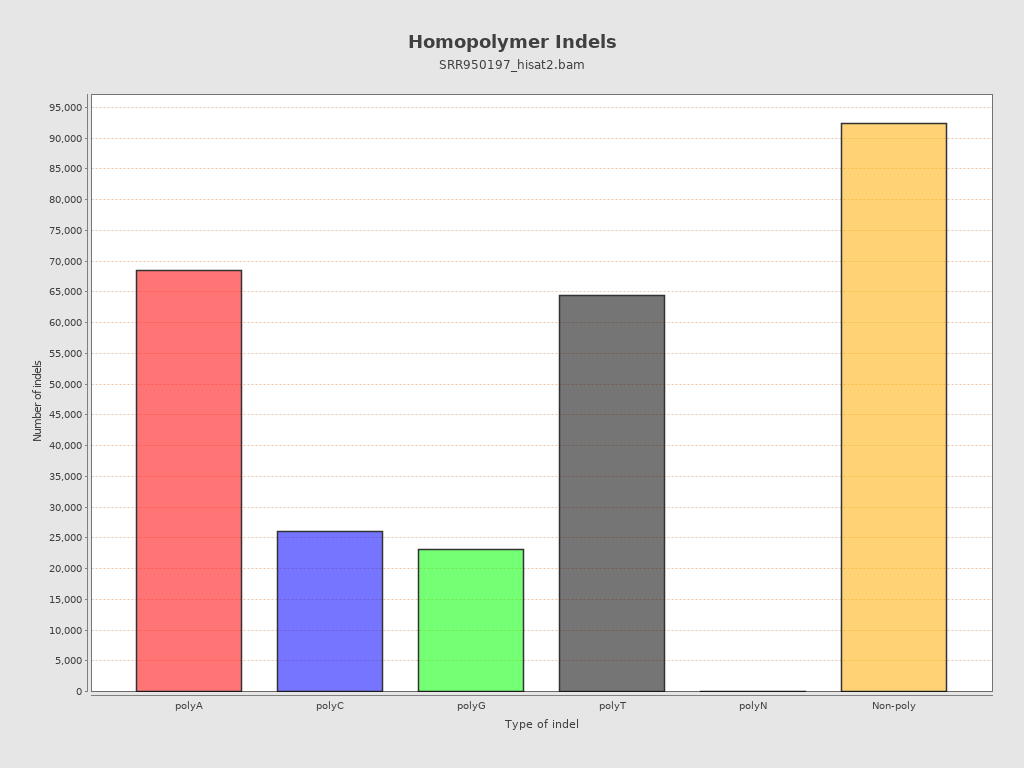
Mismatches and indels
| General error rate | 0.86% |
| Mismatches | 12,851,299 |
| Insertions | 161,599 |
| Mapped reads with at least one insertion | 1.41% |
| Deletions | 112,830 |
| Mapped reads with at least one deletion | 0.99% |
| Homopolymer indels | 66.33% |
Chromosome stats
| Name | Length | Mapped bases | Mean coverage | Standard deviation |
| GG663448.1 | 2407 | 65685 | 27.2892 | 37.5984 |
| GG663447.1 | 5093 | 3486 | 0.6845 | 0.9948 |
| GG663446.1 | 5267 | 0 | 0 | 0 |
| GG663445.1 | 5726 | 0 | 0 | 0 |
| GG663444.1 | 6104 | 0 | 0 | 0 |
| GG663443.1 | 6704 | 0 | 0 | 0 |
| GG663442.1 | 7013 | 0 | 0 | 0 |
| GG663441.1 | 7428 | 0 | 0 | 0 |
| GG663440.1 | 7433 | 0 | 0 | 0 |
| GG663439.1 | 7612 | 0 | 0 | 0 |
| GG663438.1 | 9352 | 376 | 0.0402 | 0.3365 |
| GG663437.1 | 9532 | 5645 | 0.5922 | 2.9224 |
| GG663436.1 | 9723 | 153735 | 15.8115 | 19.9529 |
| GG663435.1 | 10315 | 0 | 0 | 0 |
| GG663434.1 | 11106 | 35988 | 3.2404 | 7.8754 |
| GG663433.1 | 11483 | 0 | 0 | 0 |
| GG663432.1 | 11832 | 0 | 0 | 0 |
| GG663431.1 | 11849 | 1520 | 0.1283 | 0.6639 |
| GG663430.1 | 11959 | 0 | 0 | 0 |
| GG663429.1 | 12280 | 0 | 0 | 0 |
| GG663428.1 | 12330 | 479 | 0.0388 | 0.1953 |
| GG663427.1 | 12422 | 0 | 0 | 0 |
| GG663426.1 | 14805 | 0 | 0 | 0 |
| GG663425.1 | 15274 | 0 | 0 | 0 |
| GG663424.1 | 15855 | 0 | 0 | 0 |
| GG663423.1 | 16334 | 80 | 0.0049 | 0.0698 |
| GG663422.1 | 16757 | 84023 | 5.0142 | 12.0973 |
| GG663421.1 | 17071 | 0 | 0 | 0 |
| GG663420.1 | 17227 | 0 | 0 | 0 |
| GG663419.1 | 17524 | 637 | 0.0364 | 0.3472 |
| GG663418.1 | 17580 | 0 | 0 | 0 |
| GG663417.1 | 18806 | 0 | 0 | 0 |
| GG663416.1 | 20314 | 240 | 0.0118 | 0.1281 |
| GG663415.1 | 20172 | 75368 | 3.7363 | 3.7246 |
| GG663414.1 | 21124 | 0 | 0 | 0 |
| GG663413.1 | 21814 | 533 | 0.0244 | 0.3025 |
| GG663412.1 | 22664 | 0 | 0 | 0 |
| GG663411.1 | 23942 | 0 | 0 | 0 |
| GG663410.1 | 24438 | 1369 | 0.056 | 0.9491 |
| GG663409.1 | 30061 | 0 | 0 | 0 |
| GG663408.1 | 29608 | 76 | 0.0026 | 0.0506 |
| GG663407.1 | 31202 | 1441373 | 46.1949 | 81.8663 |
| GG663406.1 | 31468 | 0 | 0 | 0 |
| GG663405.1 | 33416 | 462 | 0.0138 | 0.1789 |
| GG663404.1 | 33436 | 76 | 0.0023 | 0.0476 |
| GG663403.1 | 34148 | 0 | 0 | 0 |
| GG663402.1 | 35232 | 38394 | 1.0897 | 2.3327 |
| GG663401.1 | 36230 | 949456 | 26.2063 | 36.7652 |
| GG663400.1 | 40055 | 75 | 0.0019 | 0.0432 |
| GG663399.1 | 47125 | 0 | 0 | 0 |
| GG663398.1 | 49169 | 0 | 0 | 0 |
| GG663397.1 | 50304 | 418 | 0.0083 | 0.0564 |
| GG663396.1 | 51171 | 78 | 0.0015 | 0.039 |
| GG663395.1 | 53466 | 0 | 0 | 0 |
| GG663394.1 | 53864 | 131 | 0.0024 | 0.0385 |
| GG663393.1 | 55852 | 1201702 | 21.5158 | 122.2996 |
| GG663392.1 | 60589 | 40959 | 0.676 | 0.6796 |
| GG663391.1 | 76172 | 0 | 0 | 0 |
| GG663390.1 | 87620 | 0 | 0 | 0 |
| GG663389.1 | 88906 | 160 | 0.0018 | 0.0424 |
| GG663388.1 | 95026 | 75 | 0.0008 | 0.0281 |
| GG663387.1 | 113334 | 33268 | 0.2935 | 0.4789 |
| GG663386.1 | 144210 | 910926 | 6.3167 | 6.3071 |
| GG663385.1 | 156336 | 113414 | 0.7255 | 3.2853 |
| GG663384.1 | 204511 | 3297034 | 16.1215 | 39.2376 |
| GG663383.1 | 258077 | 8893547 | 34.4608 | 86.3606 |
| GG663382.1 | 261570 | 7344864 | 28.0799 | 55.404 |
| GG663381.1 | 280411 | 8347904 | 29.7702 | 44.3516 |
| GG663380.1 | 351122 | 19660527 | 55.9934 | 157.3054 |
| GG663379.1 | 441739 | 18581179 | 42.0637 | 106.772 |
| GG663378.1 | 530530 | 24746233 | 46.6444 | 105.7094 |
| GG663377.1 | 695743 | 28754400 | 41.3291 | 93.3963 |
| GG663376.1 | 920403 | 39815020 | 43.2582 | 102.7892 |
| GG663375.1 | 915096 | 33096978 | 36.1678 | 86.308 |
| GG663374.1 | 967551 | 72250065 | 74.6731 | 157.2691 |
| GG663373.1 | 1058542 | 55560532 | 52.4878 | 256.9176 |
| GG663372.1 | 1221551 | 78473430 | 64.2408 | 214.5809 |
| GG663371.1 | 1250234 | 45234749 | 36.181 | 103.9676 |
| GG663370.1 | 1327755 | 89022619 | 67.0475 | 322.2838 |
| GG663369.1 | 1498222 | 100555610 | 67.1166 | 163.8044 |
| GG663368.1 | 1769553 | 58036343 | 32.7972 | 75.9572 |
| GG663367.1 | 2225114 | 103149868 | 46.3571 | 121.2696 |
| GG663366.1 | 2702831 | 248661376 | 92.0003 | 215.556 |
| GG663365.1 | 2818386 | 151691674 | 53.8222 | 168.8374 |
| GG663364.1 | 2928037 | 128404228 | 43.8533 | 103.3759 |
| GG663363.1 | 3777229 | 194885442 | 51.5948 | 143.2712 |
| GG663450.1 | 4245 | 9275 | 2.1849 | 7.8589 |
| GG663449.1 | 40201 | 172527 | 4.2916 | 11.5486 |