Input data and parameters
QualiMap command line
| qualimap bamqc -bam ../hcapsulatum/2-alignment/pathogen/bam/genome/SRR949601_hisat2.bam -nw 400 -hm 3 |
Alignment
| Command line: | "/home/dguevara/pipeline/src/../tools/hisat2-2.1.0/hisat2-align-s --wrapper basic-0 -x ../hcapsulatum/2-alignment/pathogen/indices/hisat2/genome -S ../hcapsulatum/2-alignment/pathogen/sam/genome/SRR949601_hisat2.sam -p 16 -1 ../hcapsulatum/2-alignment/host/fastq/SRR949601_1.fastq -2 ../hcapsulatum/2-alignment/host/fastq/SRR949601_2.fastq" |
| Draw chromosome limits: | no |
| Analyze overlapping paired-end reads: | no |
| Program: | hisat2 (2.1.0) |
| Analysis date: | Thu Jan 25 04:49:54 CST 2024 |
| Size of a homopolymer: | 3 |
| Skip duplicate alignments: | no |
| Number of windows: | 400 |
| BAM file: | ../hcapsulatum/2-alignment/pathogen/bam/genome/SRR949601_hisat2.bam |
Summary
Globals
| Reference size | 30,483,324 |
| Number of reads | 11,190,319 |
| Mapped reads | 7,433,632 / 66.43% |
| Unmapped reads | 3,756,687 / 33.57% |
| Mapped paired reads | 7,433,632 / 66.43% |
| Mapped reads, first in pair | 3,758,614 / 33.59% |
| Mapped reads, second in pair | 3,675,018 / 32.84% |
| Mapped reads, both in pair | 5,828,135 / 52.08% |
| Mapped reads, singletons | 1,605,497 / 14.35% |
| Read min/max/mean length | 78 / 78 / 78 |
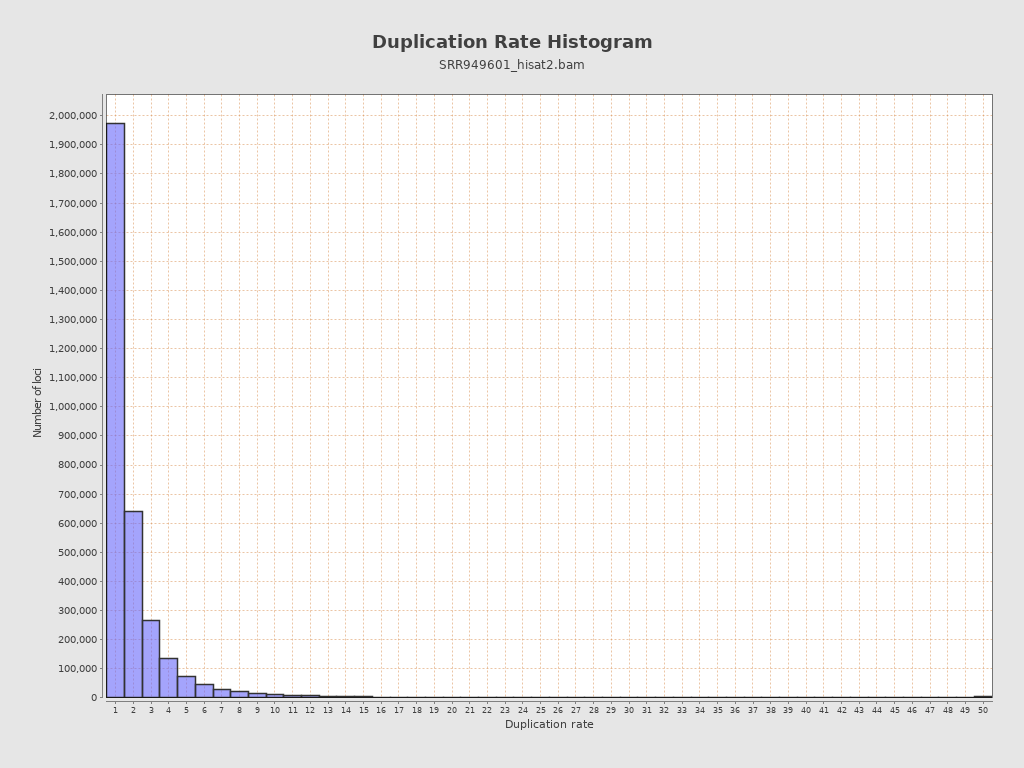
| Duplicated reads (estimated) | 4,171,621 / 37.28% |
| Duplication rate | 39.52% |
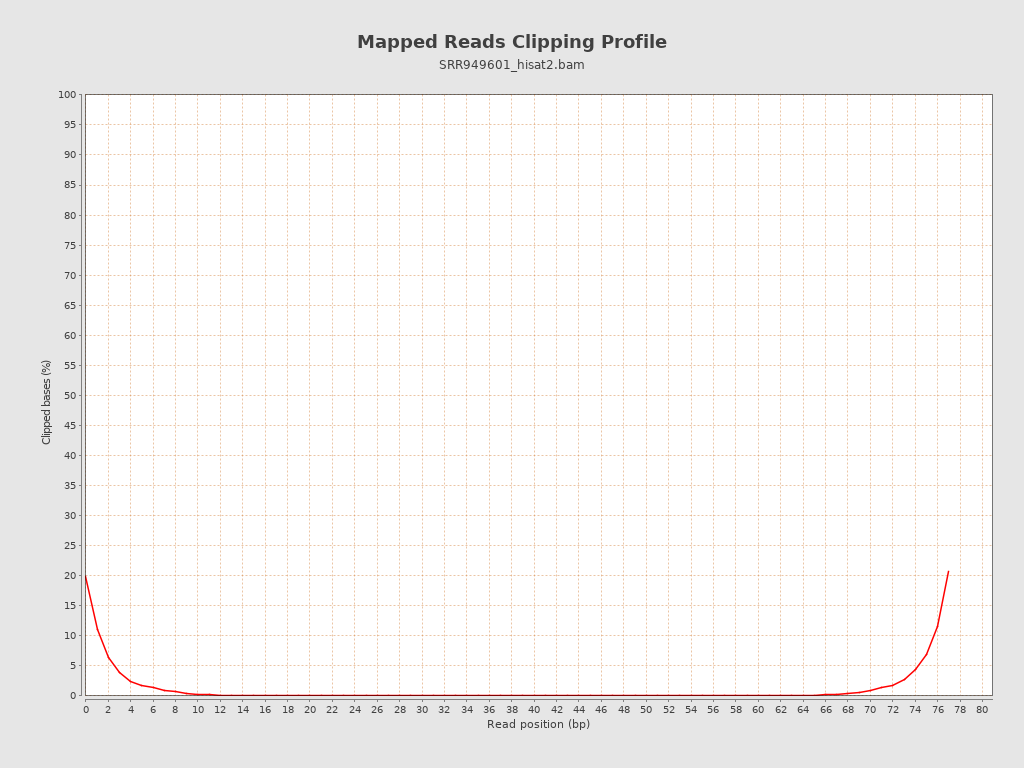
| Clipped reads | 1,134,224 / 10.14% |
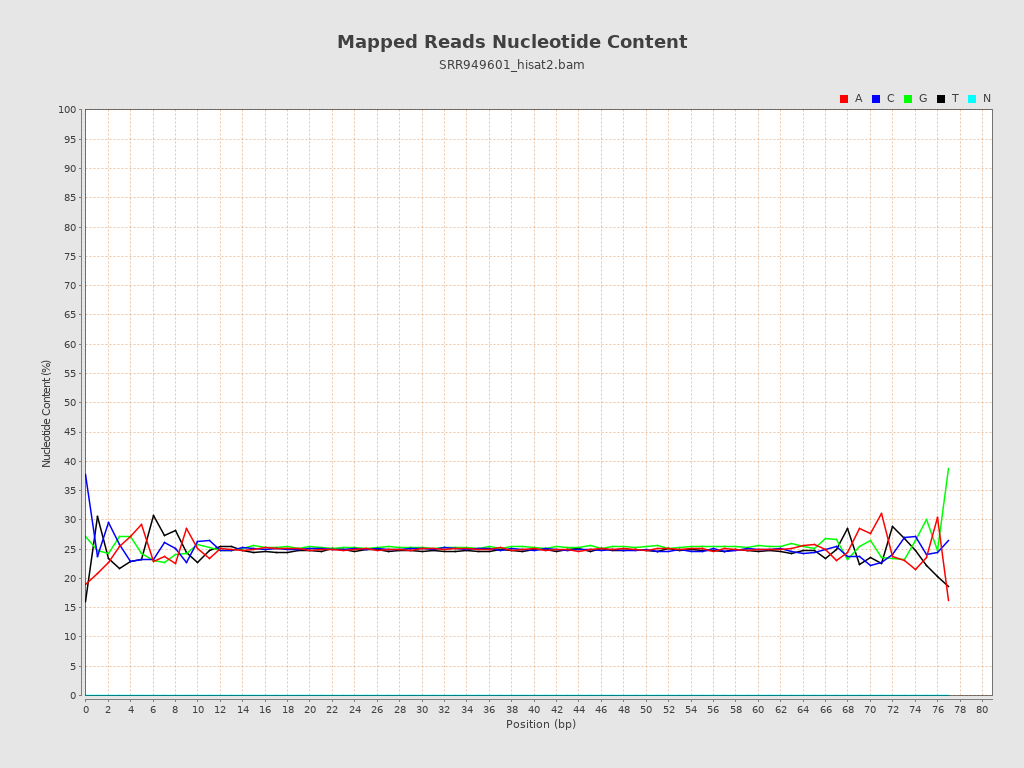
ACGT Content
| Number/percentage of A's | 143,447,519 / 24.87% |
| Number/percentage of C's | 144,414,773 / 25.04% |
| Number/percentage of T's | 142,092,544 / 24.64% |
| Number/percentage of G's | 146,833,173 / 25.46% |
| Number/percentage of N's | 291,685,073 / 50.57% |
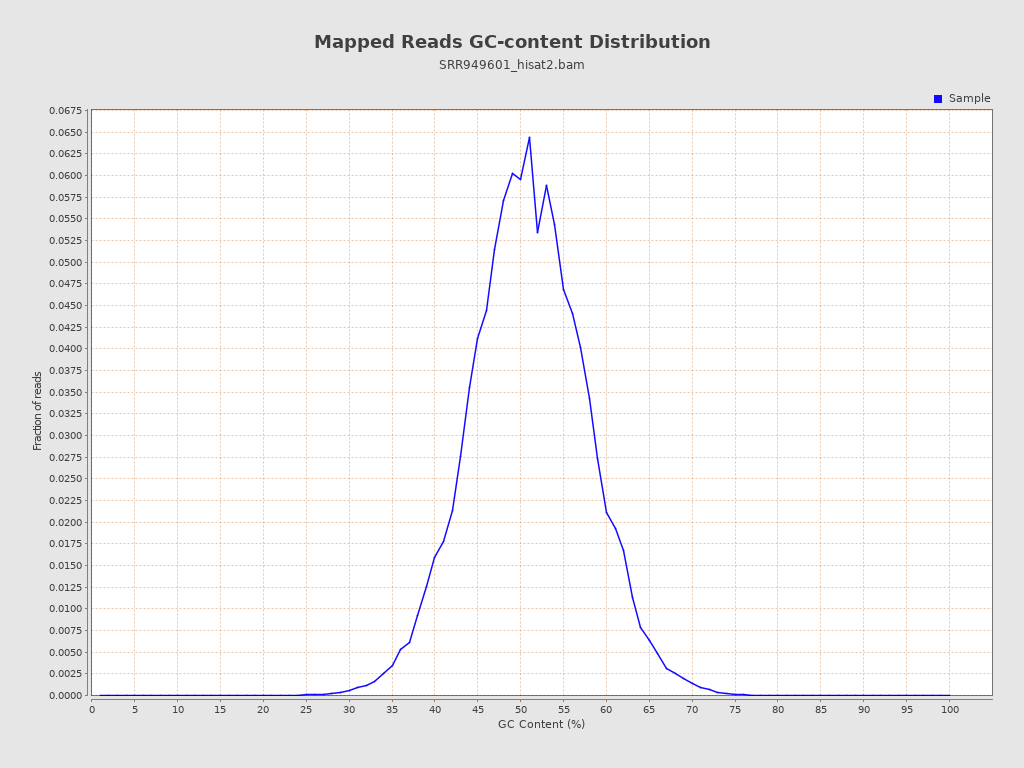
| GC Percentage | 50.49% |
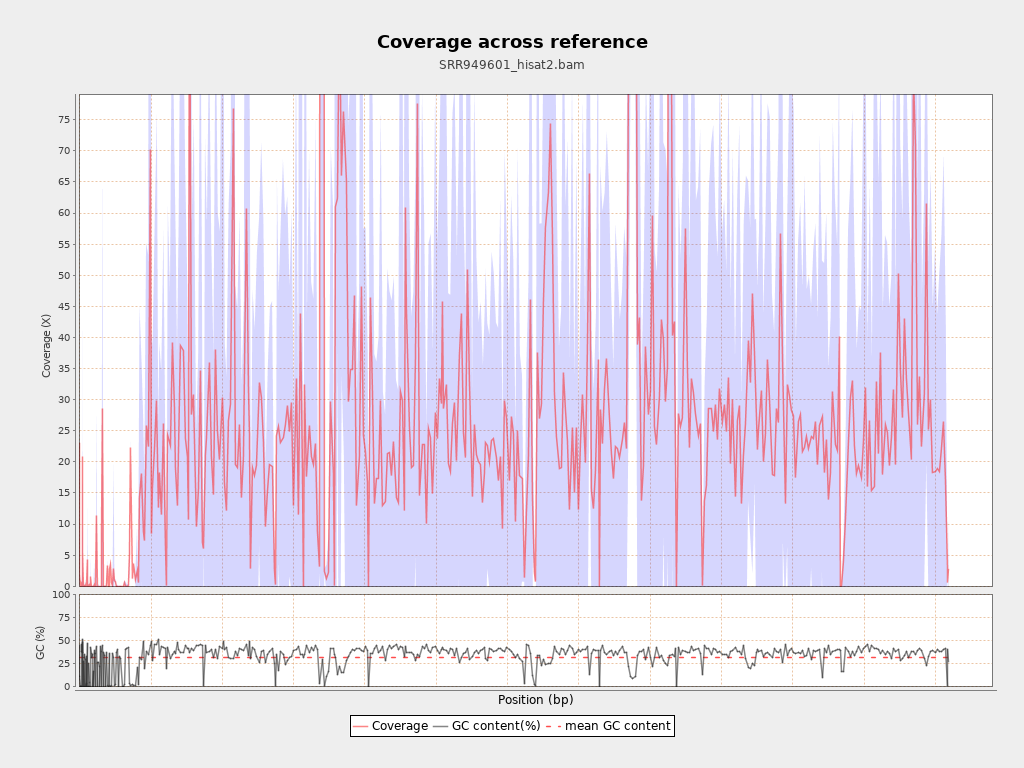
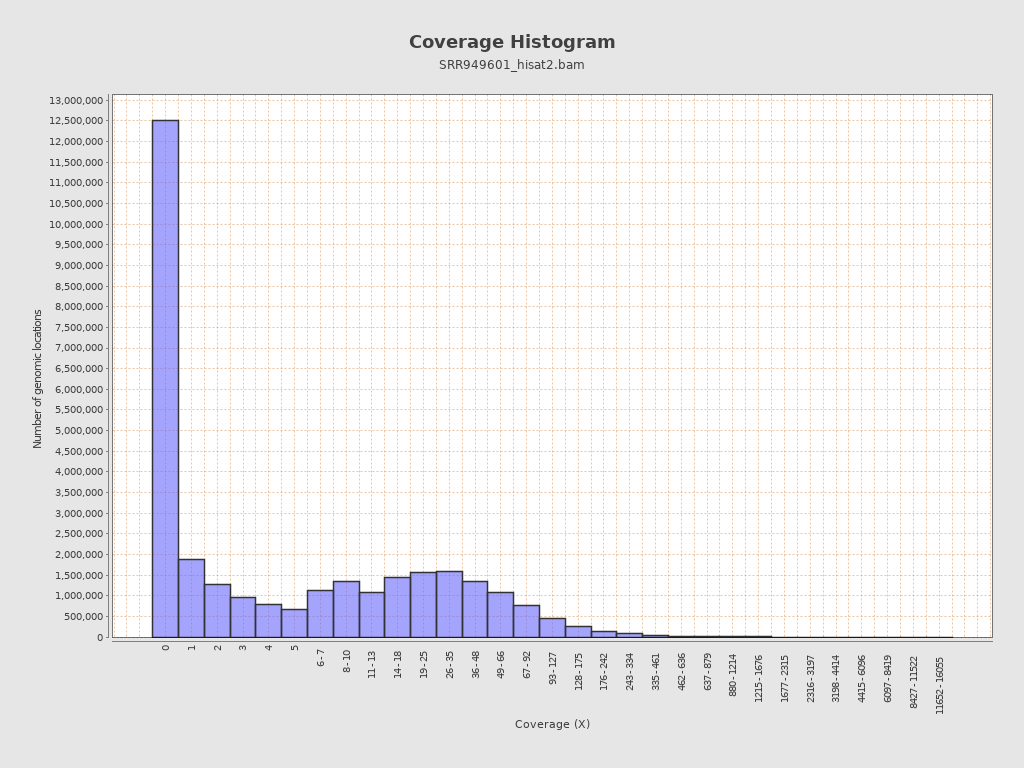
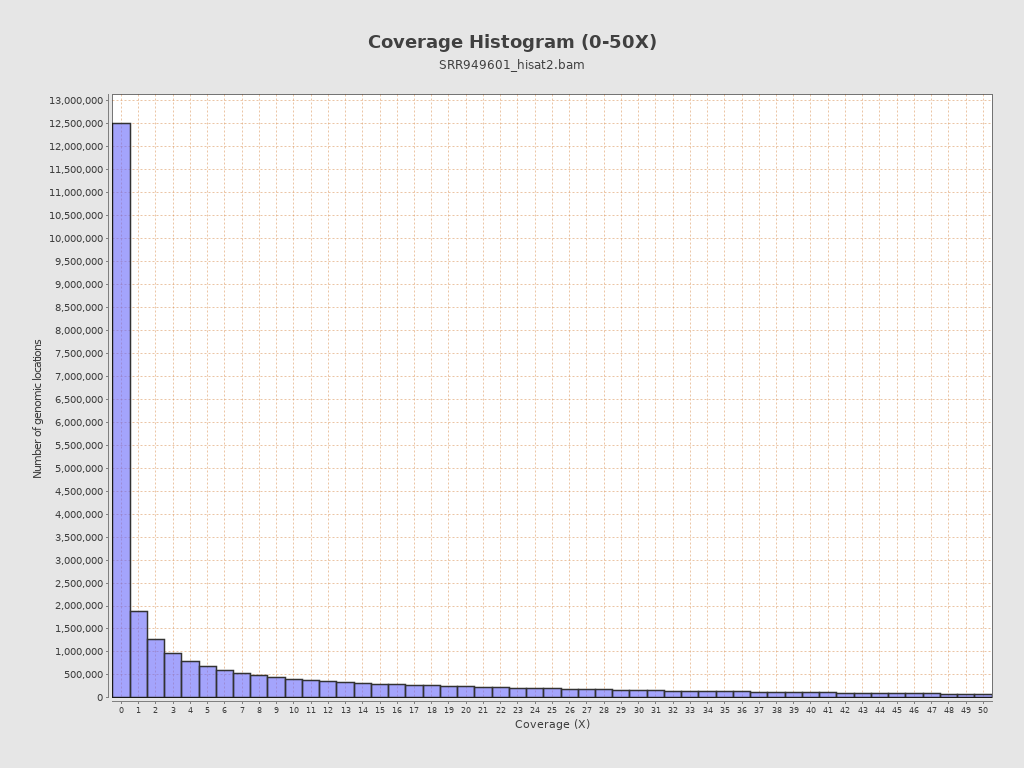
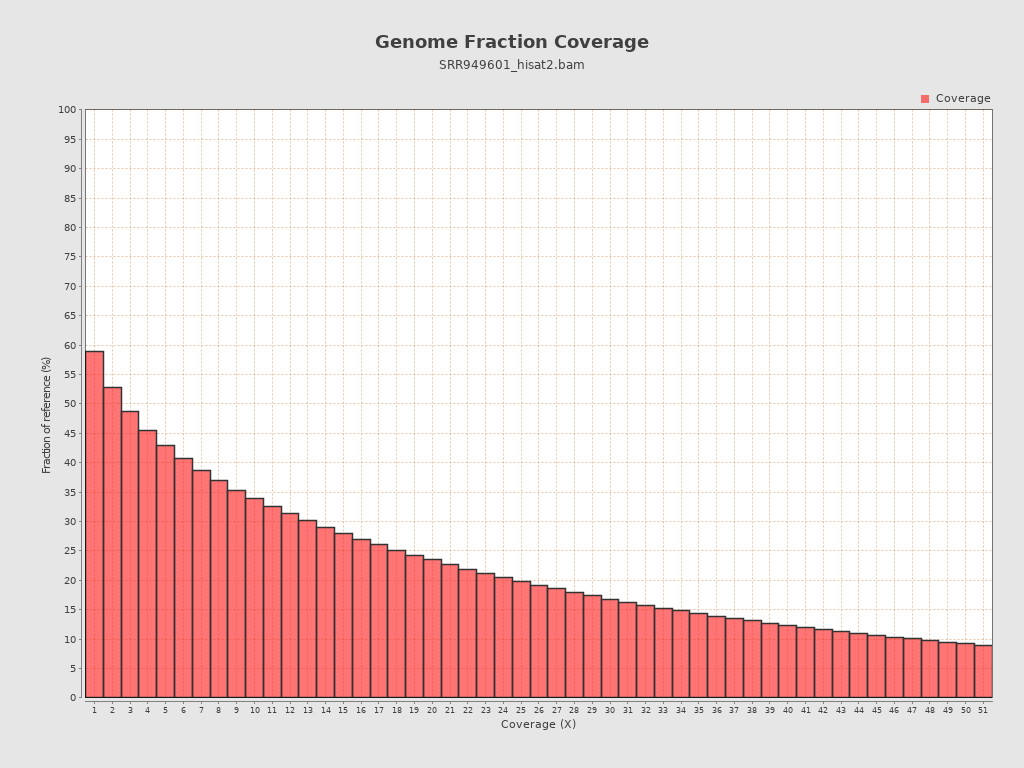
Coverage
| Mean | 28.4923 |
| Standard Deviation | 102.6435 |
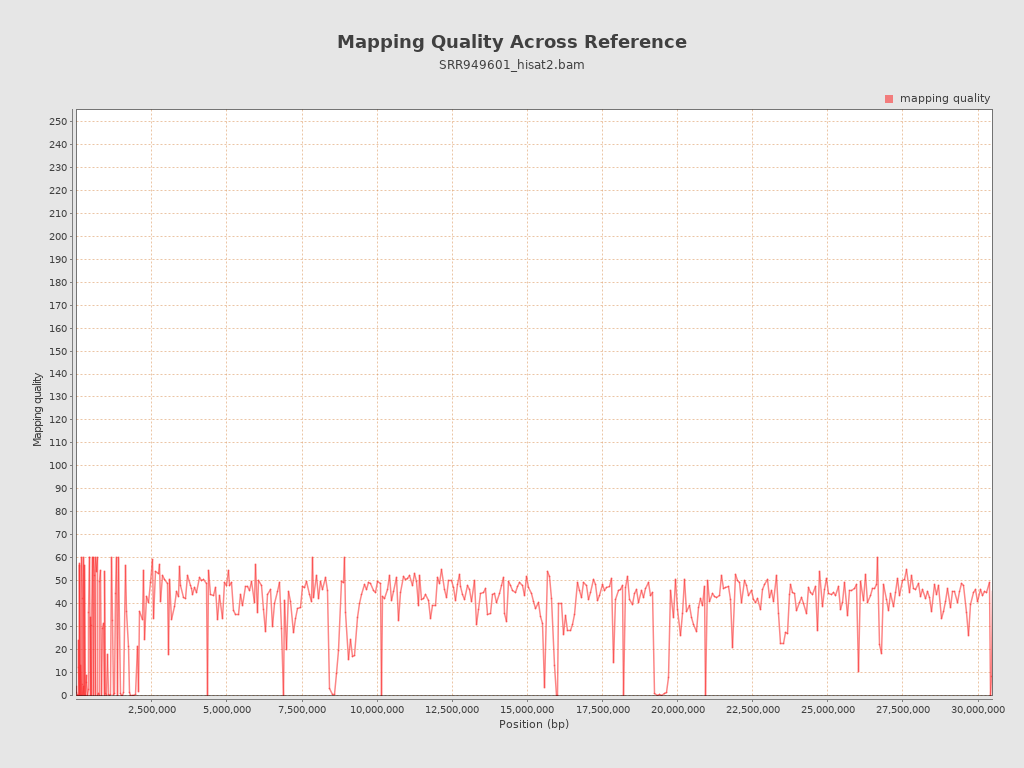
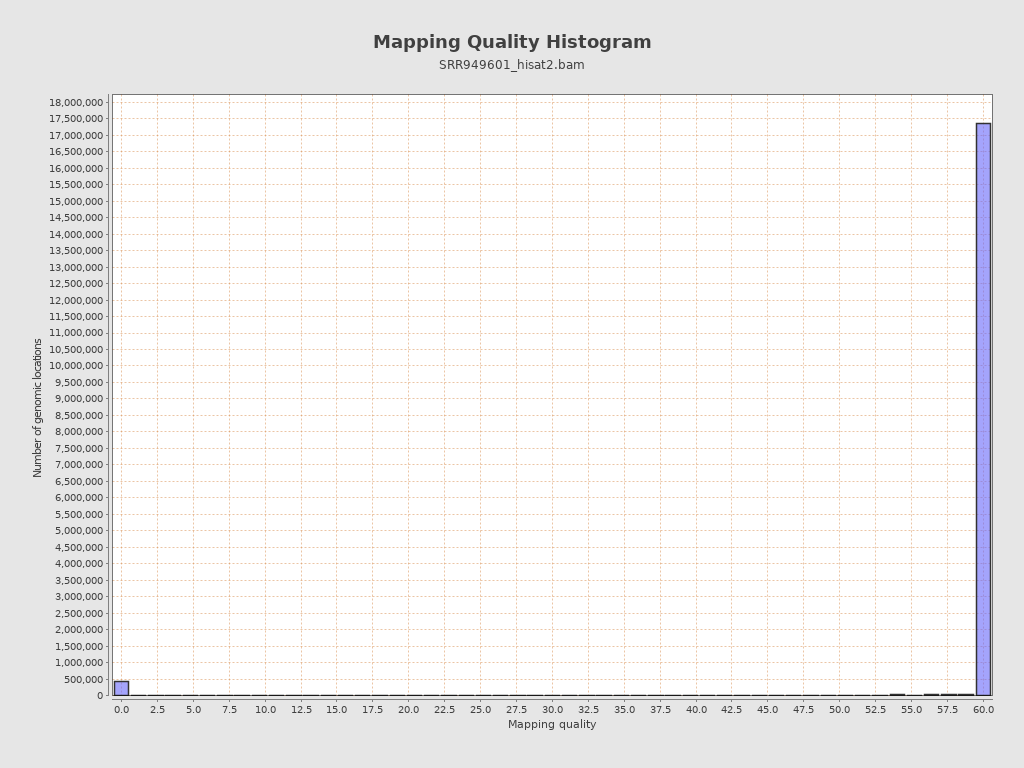
Mapping Quality
| Mean Mapping Quality | 36.63 |
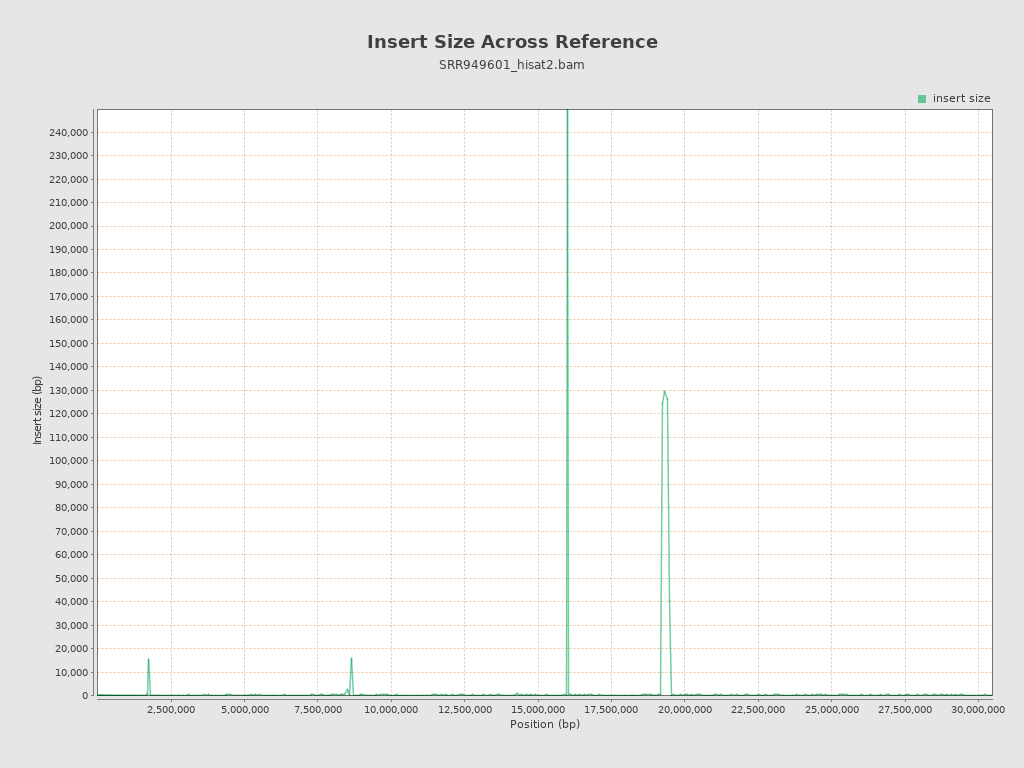
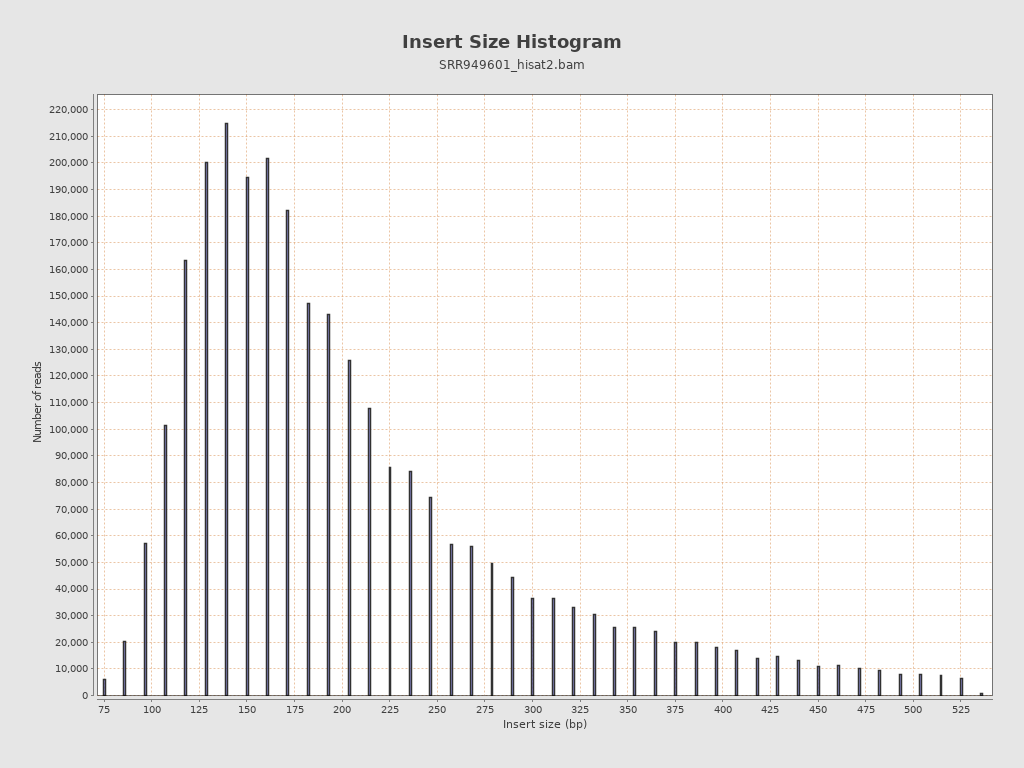
Insert size
| Mean | 2,964.73 |
| Standard Deviation | 32,142.16 |
| P25/Median/P75 | 148 / 189 / 268 |
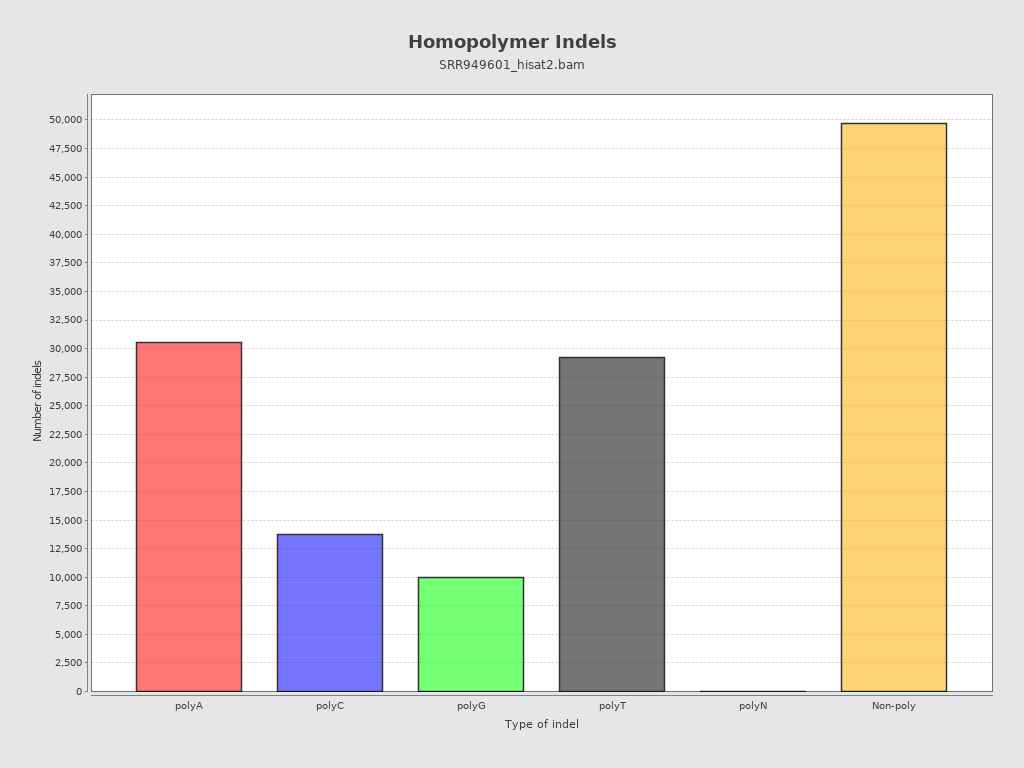
Mismatches and indels
| General error rate | 0.78% |
| Mismatches | 6,625,990 |
| Insertions | 81,514 |
| Mapped reads with at least one insertion | 1.1% |
| Deletions | 51,694 |
| Mapped reads with at least one deletion | 0.7% |
| Homopolymer indels | 62.69% |
Chromosome stats
| Name | Length | Mapped bases | Mean coverage | Standard deviation |
| GG663448.1 | 2407 | 55122 | 22.9007 | 30.0017 |
| GG663447.1 | 5093 | 10138 | 1.9906 | 2.9399 |
| GG663446.1 | 5267 | 0 | 0 | 0 |
| GG663445.1 | 5726 | 0 | 0 | 0 |
| GG663444.1 | 6104 | 0 | 0 | 0 |
| GG663443.1 | 6704 | 0 | 0 | 0 |
| GG663442.1 | 7013 | 0 | 0 | 0 |
| GG663441.1 | 7428 | 0 | 0 | 0 |
| GG663440.1 | 7433 | 0 | 0 | 0 |
| GG663439.1 | 7612 | 0 | 0 | 0 |
| GG663438.1 | 9352 | 1535 | 0.1641 | 0.7509 |
| GG663437.1 | 9532 | 2859 | 0.2999 | 1.1324 |
| GG663436.1 | 9723 | 202598 | 20.837 | 24.2738 |
| GG663435.1 | 10315 | 0 | 0 | 0 |
| GG663434.1 | 11106 | 66721 | 6.0077 | 14.5007 |
| GG663433.1 | 11483 | 0 | 0 | 0 |
| GG663432.1 | 11832 | 0 | 0 | 0 |
| GG663431.1 | 11849 | 3248 | 0.2741 | 1.5844 |
| GG663430.1 | 11959 | 0 | 0 | 0 |
| GG663429.1 | 12280 | 300 | 0.0244 | 0.2466 |
| GG663428.1 | 12330 | 550 | 0.0446 | 0.2282 |
| GG663427.1 | 12422 | 999 | 0.0804 | 0.6222 |
| GG663426.1 | 14805 | 0 | 0 | 0 |
| GG663425.1 | 15274 | 9432 | 0.6175 | 0.7693 |
| GG663424.1 | 15855 | 148 | 0.0093 | 0.0962 |
| GG663423.1 | 16334 | 0 | 0 | 0 |
| GG663422.1 | 16757 | 73262 | 4.372 | 8.413 |
| GG663421.1 | 17071 | 0 | 0 | 0 |
| GG663420.1 | 17227 | 0 | 0 | 0 |
| GG663419.1 | 17524 | 2195 | 0.1253 | 0.752 |
| GG663418.1 | 17580 | 4766 | 0.2711 | 0.3221 |
| GG663417.1 | 18806 | 0 | 0 | 0 |
| GG663416.1 | 20314 | 2218 | 0.1092 | 0.989 |
| GG663415.1 | 20172 | 389 | 0.0193 | 0.1629 |
| GG663414.1 | 21124 | 78 | 0.0037 | 0.0607 |
| GG663413.1 | 21814 | 541 | 0.0248 | 0.1742 |
| GG663412.1 | 22664 | 136 | 0.006 | 0.0582 |
| GG663411.1 | 23942 | 0 | 0 | 0 |
| GG663410.1 | 24438 | 5561 | 0.2276 | 3.8199 |
| GG663409.1 | 30061 | 466 | 0.0155 | 0.2519 |
| GG663408.1 | 29608 | 617 | 0.0208 | 0.259 |
| GG663407.1 | 31202 | 357202 | 11.448 | 17.7361 |
| GG663406.1 | 31468 | 71 | 0.0023 | 0.0474 |
| GG663405.1 | 33416 | 778 | 0.0233 | 0.3483 |
| GG663404.1 | 33436 | 78 | 0.0023 | 0.0482 |
| GG663403.1 | 34148 | 77 | 0.0023 | 0.0474 |
| GG663402.1 | 35232 | 97965 | 2.7806 | 6.0231 |
| GG663401.1 | 36230 | 1032476 | 28.4978 | 39.6136 |
| GG663400.1 | 40055 | 152 | 0.0038 | 0.0615 |
| GG663399.1 | 47125 | 597 | 0.0127 | 0.1771 |
| GG663398.1 | 49169 | 1527 | 0.0311 | 0.4603 |
| GG663397.1 | 50304 | 145024 | 2.883 | 2.9229 |
| GG663396.1 | 51171 | 509 | 0.0099 | 0.1078 |
| GG663395.1 | 53466 | 173997 | 3.2543 | 3.2518 |
| GG663394.1 | 53864 | 24467 | 0.4542 | 0.6511 |
| GG663393.1 | 55852 | 163440 | 2.9263 | 17.3334 |
| GG663392.1 | 60589 | 51004 | 0.8418 | 0.8995 |
| GG663391.1 | 76172 | 831 | 0.0109 | 0.2328 |
| GG663390.1 | 87620 | 232 | 0.0026 | 0.0879 |
| GG663389.1 | 88906 | 78 | 0.0009 | 0.0296 |
| GG663388.1 | 95026 | 44080 | 0.4639 | 0.5988 |
| GG663387.1 | 113334 | 4149 | 0.0366 | 0.3221 |
| GG663386.1 | 144210 | 1847041 | 12.808 | 12.7845 |
| GG663385.1 | 156336 | 319604 | 2.0443 | 4.4217 |
| GG663384.1 | 204511 | 2739638 | 13.396 | 23.3485 |
| GG663383.1 | 258077 | 8138542 | 31.5353 | 151.4329 |
| GG663382.1 | 261570 | 5516883 | 21.0914 | 36.2152 |
| GG663381.1 | 280411 | 4422477 | 15.7714 | 24.2231 |
| GG663380.1 | 351122 | 9482771 | 27.0071 | 42.1487 |
| GG663379.1 | 441739 | 11608513 | 26.2791 | 45.9898 |
| GG663378.1 | 530530 | 15778547 | 29.7411 | 166.5807 |
| GG663377.1 | 695743 | 17864979 | 25.6776 | 50.3603 |
| GG663376.1 | 920403 | 27310509 | 29.6723 | 107.4527 |
| GG663375.1 | 915096 | 16054734 | 17.5443 | 27.0873 |
| GG663374.1 | 967551 | 24064314 | 24.8714 | 77.8823 |
| GG663373.1 | 1058542 | 82406196 | 77.8488 | 360.8732 |
| GG663372.1 | 1221551 | 54345775 | 44.4892 | 77.0841 |
| GG663371.1 | 1250234 | 27232788 | 21.7822 | 49.803 |
| GG663370.1 | 1327755 | 38105329 | 28.6991 | 109.8392 |
| GG663369.1 | 1498222 | 39233117 | 26.1865 | 50.3691 |
| GG663368.1 | 1769553 | 35095745 | 19.8331 | 33.4572 |
| GG663367.1 | 2225114 | 70276557 | 31.5834 | 61.5638 |
| GG663366.1 | 2702831 | 121713538 | 45.0319 | 165.3508 |
| GG663365.1 | 2818386 | 76005305 | 26.9677 | 48.5344 |
| GG663364.1 | 2928037 | 75394656 | 25.7492 | 47.8547 |
| GG663363.1 | 3777229 | 100932171 | 26.7212 | 58.8279 |
| GG663450.1 | 4245 | 2250 | 0.53 | 1.9703 |
| GG663449.1 | 40201 | 104992 | 2.6117 | 8.2912 |